This year, Australian Open broadcasts threw a screwball into their traditional post-match statsheet. In the addition to the usual numbers–winners, unforced errors, break points won, and so forth–the graphic shows something called “Hunting 3rd Shot Forehand.” I must have missed a memo. This is the first I’ve heard of such a thing.
A puff piece for the Tennis Australia data group offers something of a definition. The new stat measures “the times the server forehands their first post-serve hit, indicating their desire to dictate the point.” Um, ok. In other words, when the service return comes back, how often does the server hit a forehand with his next shot?
The intention behind the metric is straightforward. You hear a lot these days about the “plus-one”–the server’s second shot. While the serve is the most important stroke in tennis, the plus-one shot is the next-most crucial opportunity to attack. Both because it arises often, and because it offers a chance to define the direction of the rally, even if it’s not yet possible to put the ball away.
It is easier to dictate play with a forehand than a backhand; the potential trajectories of the stroke give a player more options. Beyond that, most men have better forehands than backhands. (The stat appears on broadcasts for both men’s and women’s matches, but today I’m going to talk about the men’s game.) If the goal is to command the rally with the plus-one shot, it’s better to hit a forehand than a backhand. A higher “Hunting 3rd Shot Forehand” number, then, is better.
Before we go further: I simply can’t use this name. It’s long and confusing. (Is the player hunting for the forehand? For a winner? For a silly rabbit?) I’m going to call it “3rd Shot FH%” or “3F%” for short.
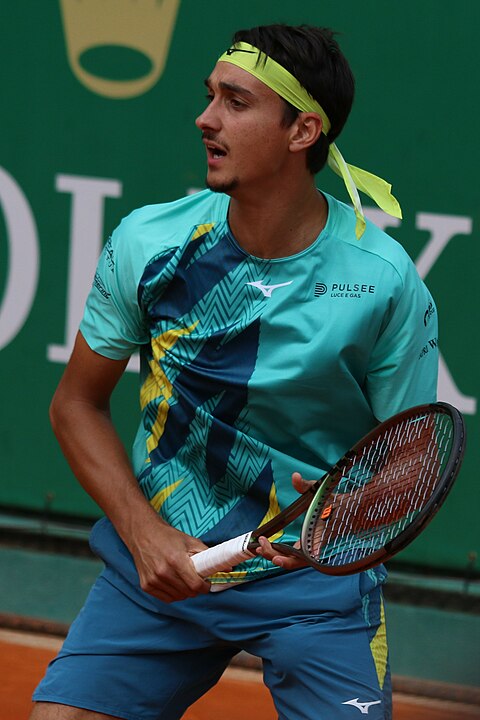
(And yes, I promise to get to Sonego eventually.)
The stat is not as straightforward as the intention behind it. The implication of 3F%, I think, is something like, “How hard did the player try to hit plus-one forehands?” A possible further implication is, “How well did the returner prevent his opponent from hitting plus-one forehands?” The second question prompts yet another: “How well did the server keep the returner from sending balls to his backhand?”
It may be possible to separate some of those questions, but there’s a lot more spadework to do before we get there.
What is normal?
(You might doubt whether I am well-situated to answer. Still, we soldier on.)
Your TV screen shows you some “Hunting 3rd Shot Forehand” numbers. Are they good?
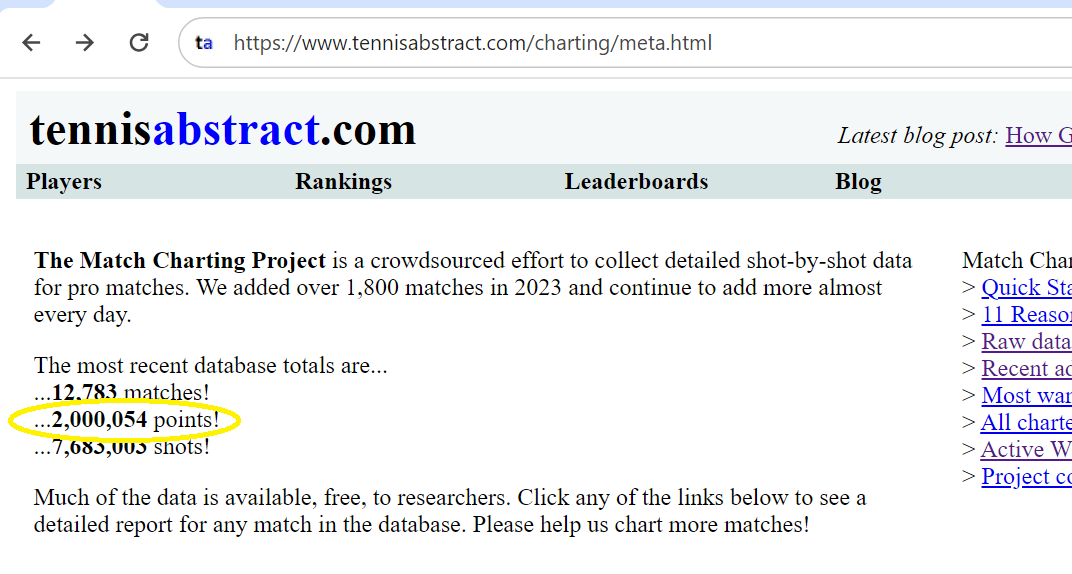
The 3F% metric can be calculated from Match Charting Project data, so we have thousands of data points to draw upon. Based on men’s matches since 2014, the average 3F% is 64.7%. The middle third of player-matches falls between 59.3% and 70.9%. Take a little liberty with rounding, and we can say that “normal” is the range from 60% to 70%. Less than 60%, and you’re doing something wrong–or you’d rather hit your backhand, or your opponent had a day. More than 70%, and you were really getting things done in the plus-one department.
Some players consistently land at the far ends of the distribution. Here are career numbers for the top ten active players by this metric, along with 15 more names of interest:
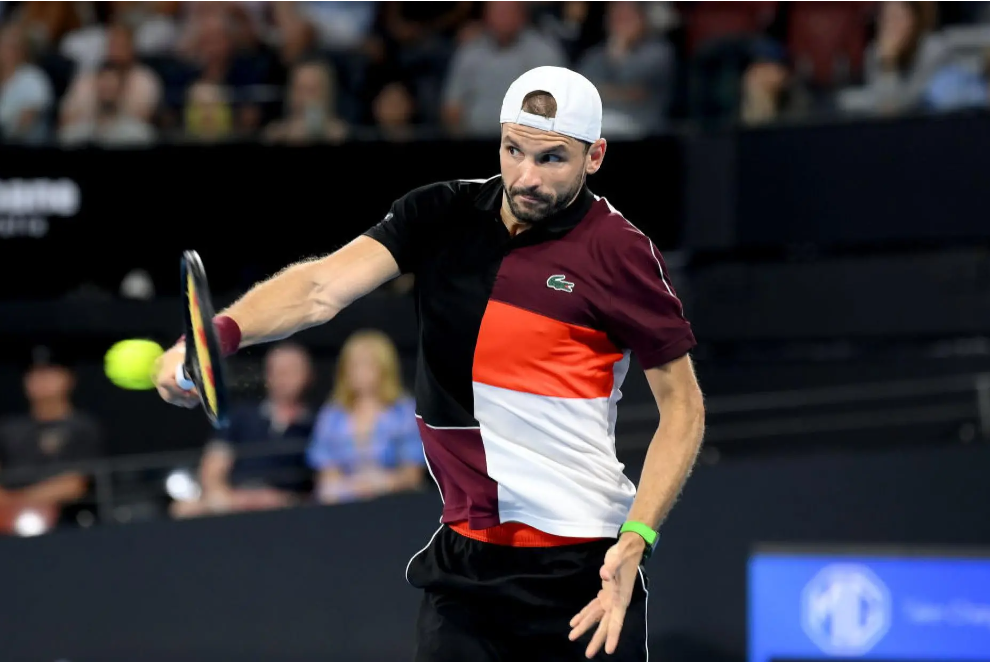
Player                3F%
Lorenzo Sonego      78.6%
Rafael Nadal        77.7%
Joao Sousa          77.6%
Denis Shapovalov    77.1%
Albert Ramos        76.0%
Jeremy Chardy       75.7%
Milos Raonic        74.6%
Stefanos Tsitsipas  74.4%
Casper Ruud         73.9%
Grigor Dimitrov     73.9%
* * * * * * * * * * * * *
Holger Rune         69.7%
Dominic Thiem       69.3%
Hubert Hurkacz      67.5%
Carlos Alcaraz      67.2%
Andrey Rublev       64.7%
Jannik Sinner       62.6%
Alex de Minaur      61.2%
Stan Wawrinka       60.9%
Andy Murray         60.0%
Taylor Fritz        58.3%
Diego Schwartzman   56.9%
Novak Djokovic      56.2%
Frances Tiafoe      55.8%
Alexander Zverev    51.1%
Daniil Medvedev     50.0%
There’s Lorenzo!
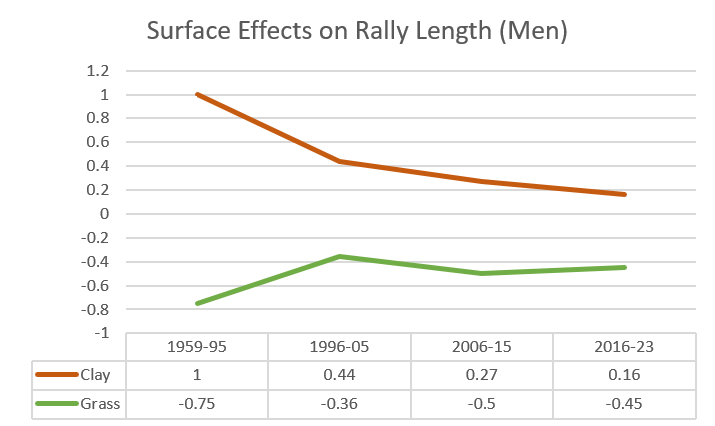
The top of the list gives you an idea of what sorts of game styles result in lots of plus-one forehands. Big serves help. Left-handedness works in your favor, perhaps since everyone trains so hard to return to a right-hander’s backhand side. Some clay-courters do well, as they are less likely to think of the serve as a point-ending shot on its own, focusing instead on how it can set up the point.
It also helps to try to hit plus-one forehands. Neither Zverev nor Medvedev seem to think in those terms, so their low 3F% ratings don’t reflect any lack of execution.
Does this even matter?
Some valuable on-screen real estate–and an enormous amount of coaching time–would be wasted if 3F% didn’t correlate with points won. Fortunately for the conventional wisdom, it does: A plus-one forehand is more likely to lead to a point for the server than a plus-one backhand is.
57.5% of plus-one forehands eventually turn into a point won, compared to 50.9% of plus-one backhands. That’s a ratio of 1.13, a number that will be more useful as a reference point in a moment.
The value of a plus-one forehand depends on the player. Matteo Berrettini wins 58.5% of plus-one forehand points but only 44.6% of plus-one backhands. That’s a ratio of 1.31, one of the highest of any active player. For him, 3F% certainly matters: All else equal, more plus-one forehand points leads to better results overall.
(A word of caution, though: The marginal plus-one forehand point–that is, the next return that he might have ran around to hit a forehand, but didn’t–might not have improved his results for the better. Presumably Matteo knows his own capabilities, and he hits forehands only on those points where they improve his odds of winning. The marginal plus-one forehand, for a player like him, is a fairly desperate foray into the doubles alley.)
For others, the plus-one choice barely registers. Zverev wins 56.7% of plus-one forehands and 52.8% of backhands, a ratio of 1.07. Every other top-tenner has a wider split, but there are more extreme examples. Adrian Mannarino wins more points behind his plus-one backhand than forehand, 55.4% to 52.3%.
Sonego, our 3F% champion, gains nearly as much from his plus-one forehands as Berrettini does. He wins 57.1% of plus-one forehand points, against 44.4% for backhands. It isn’t easy to find his backhand, but it’s worth the attempt.
What about first and second serves?
As far as I know, broadcasts don’t separate the “Hunting” metric into first and second serves. But they should! Early in the rally, the effect of the serve retains plenty of influence.
The following table shows some of the tour-wide averages I’ve discussed so far–3F%, plus-one forehand points won, and plus-one backhand points won–broken down into first-serve and second-serve points:
AVERAGES     3F%  FH W%  BH W%
1st serve  71.1%  60.3%  53.9%
2nd serve  55.2%  52.2%  48.1%
Total      64.7%  57.5%  50.9%
Bigger serves generate weaker (and less targeted) returns, which invite more forehands. Behind second serves, ATPers only manage to hit forehands on 55% of their plus-one shots. On the other hand, the gap in points won isn’t as wide.
A fascinating outlier is Andrey Rublev. He finds the forehand on over 80% of his first-serve points, one of the highest numbers on tour. Behind the second serve, though, he hits plus-one forehands only 43% of the time–one of the lowest! It’s no secret that his second serve is a liability, but such a gap still comes as a surprise.
Sonego is a more typical case: lots more plus-one forehands on the first serve than the second (83% to 71%), and a wide gap in the results between forehands and backhands regardless of which serve it supports.
Converting from the backhand corner
With a few exceptions like Mannarino, most players want to hit as many plus-one forehands as they plausibly can. If the return goes to their forehand corner, obviously they’ll hit a forehand. If the return comes back up the middle, it’s either a no-doubt forehand or an easy decision to take a couple of steps around the ball and avoid the backhand.
The real decisions happen when the return goes to the backhand corner. Now we’ve moved into true Match Charting Project territory. I don’t know if the Australian Open has the data to drill down this far; either way, it probably won’t show up on your TV screen. In this corner of the internet, though, we’ll dive in.
About one-quarter of in-play returns go to the server’s backhand corner. Ernests Gulbis set the standard for plus-one backhanding, running around just 2% of those balls. On average, players go for the forehand 26.6% of the time. Even Zverev and Medvedev go that route sometimes: 9% for the German and 8% for the Russian.
Here again, Sonego sets the standard. He runs around 49% of those returns, winning 53% of the resulting plus-one forehands versus 47% of the backhands he can’t avoid. No other active player creates so many forehand opportunities. Of retired players in the charting dataset, only Carlos Moya and Leonardo Mayer were more extreme.
Here’s the same tour-averages table as above, now limited to points with returns to the backhand corner:
BH CORNER    3F%  FH W%  BH W%
1st serve  34.9%  61.3%  53.0%
2nd serve  16.9%  52.3%  47.3%
Total      26.6%  58.7%  50.0%
It’s possible that many players–though probably not Sonego–are leaving some points on the table here. I’m surprised to see that the gap in win percentages between plus-one forehands and backhand is bigger for backhand-corner returns than returns in general. Backhand-corner returns are somewhat similar to each other–certainly more similar than returns in general. Thus I would expect that players would find an equilibrium in which they ran around enough shots that their forehand and backhand winning percentages end up closer together. Perhaps some ATPers overestimate the quality of their backhands, or maybe they don’t want to look foolish taking a chance in the doubles alley. Or they might just know what they’re doing, and the guy typing on his laptop should shut up about it.
Hunting Alcaraz
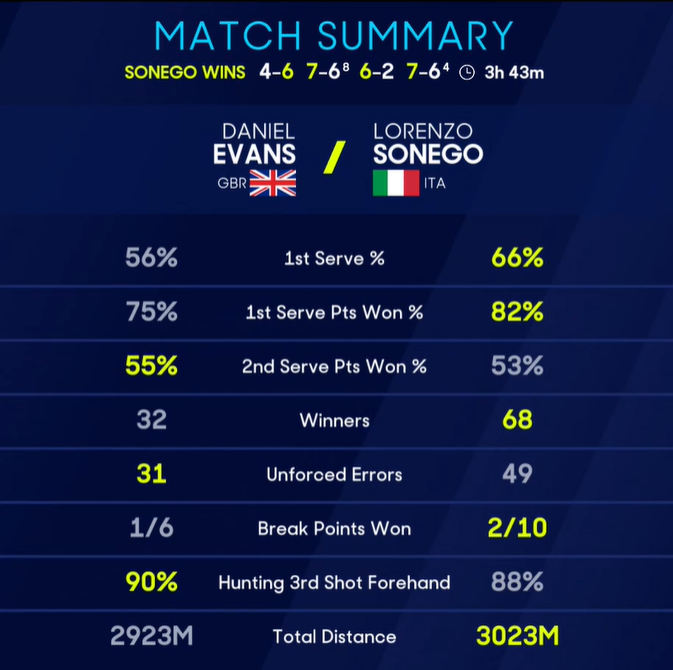
Sonego beat Dan Evans in Melbourne yesterday, earning him a date on Thursday with second-seeded Carlos Alcaraz. While there’s more to the match than Sonego’s hunt to maximize his 3F%, the battle for the Italian’s plus-one court position will play a big part.
Alcaraz is a bit better than the typical tour player at landing his returns in the server’s backhand corner, something he does 30.8% of the time, compared to the norm of 27.0%. But it doesn’t make him particularly effective at avoiding his opponents’ plus-one forehand. They find the preferred shot 64.5% of the time, almost exactly tour average. The story is the same when we look at first and second serves separately: Carlitos neither prevents nor encourages plus-one forehands.
There are, naturally, returners who consistently limit plus-one options; others don’t have the skills to avert a barrage of forehands. Jenson Brooksby allows opponents plus-one forehands on just 57.7% of his returns; Andy Murray and (surprisingly?) Rublev keep opponents’ numbers down around 59%. At the other extreme, Cam Norrie allows servers to hit plus-one forehands almost three-quarters of the time. He’s one of many lefties who struggle by this metric: Since serve returns are disproportionately backhands themselves, left-handers must often go down the line to put a return in a right-hander’s backhand corner. Norrie finds that corner only one-fifth of the time.
Well-targeted returns are good; forcing servers to hit plus-one backhands pays dividends. Alcaraz, though, is proof that you can make your money on the fourth shot and beyond. Opponents hit plenty of plus-one forehands against him, yet no matter what they choose for the second shot, they struggle to win the point. First serves, second serves, plus-one forehands, plus-one backhands … Carlitos beats tour average by multiple percentage points in every category. This table shows the difference between how players fare against Alcaraz and the average level, in percentage points:
VS CARLOS  rel FH W%  rel BH W%
1st serve      -6.9%      -2.5%
2nd serve      -2.2%      -5.0%
Total          -5.7%      -3.5%
In other words, a plus-one forehand is 5.7 percentage points less likely to turn out well against Alcaraz than it is against an average ATP player. That’s a hefty margin for something that accounts for nearly half of the typical player’s service points.
It’s fun to know that Sonego occupies the unique position that he does on tour, and it’s entertaining to see some of the far-fetched places from which he’ll smack an inside-out forehand. It might even be useful to see the Italian’s “Hunting” stat at the conclusion of tomorrow’s match.
Alas, “setting up the point” and “winning the point” are two different things. Sonego might hunt down enough forehands against Alcaraz to manage the first, but the second is a considerably bigger ask.
* * *
Subscribe to the blog to receive each new post by email:

_(52035355412).jpg)
.jpg)
_06.jpg)
_07.jpg)
.jpg)