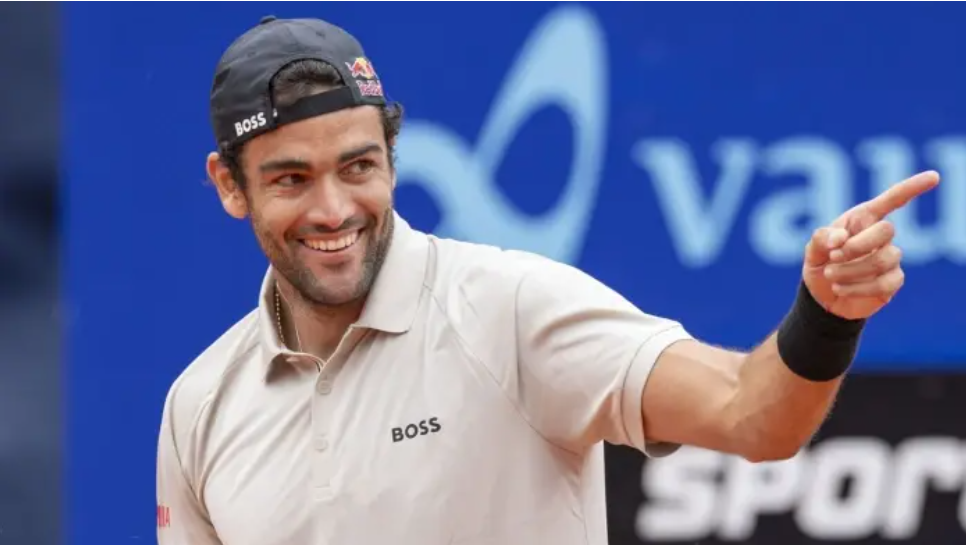
Anna Kalinskaya At Her Peak

Also today: Upsets, (partly) explained; January 23, 1924

Anna Kalinskaya in the 2020 Fed Cup qualifying round. Credit: Nuță Lucian

Should we have seen this coming? Of all the surprises in the top half of the 2024 Australian Open women’s draw, Anna Kalinskaya’s run to the quarter-finals stands as one of the biggest. The 25-year-old was ranked 75th entering the tournament, and she had never reached the third round of a major in 13 previous main-draw attempts.

Had we looked closely before the tournament, we wouldn’t have found a title contender, exactly, but we would have identified Kalinskaya as about as dangerous as a 75th-ranked player could possibly be. She finished 2023 on a 9-1 run, reaching the final at the WTA 125 in Tampico, then winning the title at the Midland 125, where she knocked out the up-and-coming Alycia Parks in the semi-finals. 2024 started well, too: The Russian upset top-tenner Barbora Krejcikova in Adelaide, then almost knocked out Daria Kasatkina in a two hour, 51-minute match two days later.

The only reason her official ranking is so low is that she missed nearly four months last summer to a leg injury that she picked up in the third round in Rome. Her two match wins at the Foro Italico pushed her up to 53rd in the world, just short of her career-best 51st, set in 2022. The Elo algorithm, which measures the quality of her wins rather than the number of tournaments she was healthy enough to play, reflects both her pre-injury successes and the more recent hot streak. Kalinskaya came to Melbourne as the 31st-ranked woman on the Elo list.

These alternative rankings put a different spin on her path through the Australian Open draw so far. Here are the results from her first four rounds, in which she appeared to be the underdog three times:

Don’t be fooled!

Elo has some adjustments to make:

Round  Opponent  Elo Rk  Elo vRk  
R16    Paolini       31       37  
R32    Stephens      31       50  
R64    Rus           31      107  
R128   Volynets      31      139

Kalinskaya was hardly an early favorite–Stephens did her the favor of taking out Kasatkina, and Anna Blinkova (who lost to Paolini) eliminated the third-seeded Elena Rybakina. But given how the draw worked out, seeing the Russian’s name in the quarter-finals wasn’t so unlikely after all.

More luck

Kalinskaya has a dangerous forehand and a solid backhand, but she isn’t an aggressive player by the standards of today’s circuit. Her 14 matches logged by the Match Charting Project average 4.2 strokes per point, and that skews low because it includes three meetings with Aryna Sabalenka. Yesterday’s fourth-round match against Paolini took 5.3 strokes per point, and the third-rounder with Stephens was similar.

By Aggression Score, the 25-year-old rates modestly below average, at -17 in rallies and -15 on returns. While she doesn’t have any weaknesses that prevent her from ending points earlier, she’s more comfortable letting the rally develop. When Paolini played along, the results were remarkable: 32 points reached seven shots or more yesterday, and Kalinskaya didn’t end any of them with an unforced error.

The downside of such a game style is that a lot of opponents won’t be so cooperative. Last fall, the Russian lost back-to-back-to-back matches against Ekaterina Alexandrova, Viktoria Hruncakova, and Ashlyn Krueger, three women who opt for big swings and short points. By contrast, consider the Rally Aggression Scores of the quartet Kalinskaya has faced in Melbourne:

Round  Opponent  AggScore  
R16    Paolini         -5  
R32    Stephens       -16  
R64    Rus            -59  
R128   Volynets       -38

Paolini and Stephens have roughly similar profiles to Kalinskaya’s own; Rus and Volynets are even more conservative.

This isn’t just a convenient narrative: Kalinskaya really is better against more passive players. She has played 118 career tour-level matches against women with at least 20 matches in the charting database. Sort them by Rally Aggression Score and separate them into four equal bins, and the Russian’s preferences become clear:

AggScore Range  Match Win%  
57 to 175            35.7%  
0 to 56              46.4%  
-27 to -1            50.0%  
-137 to -27          59.4%

If the whole tour were as patient as she is, the Russian would already be a household name.

Alas, it’s rare to draw four straight players as conservative as the bunch Kalinskaya has faced in Melbourne. And having reached the quarter-finals, her luck has run out. Her next opponent is Qinwen Zheng, who has a career Aggression Score of 27 and upped that number in 2023. It could be worse–fellow quarter-finalists Sabalenka and Dayana Yastremska are triple-digit aggressors–but it is a different sort of challenge than she has faced at the tournament so far.

To win tomorrow, Kalinskaya will need to play as well as she has for the last few months, only a couple of shots earlier in the rally. Otherwise, Zheng will end points on her own terms, and thousands of potential new fans will be convinced that Kalinskaya really is just the 75th best player in the world.

* * *

Why are upsets on the rise?

Only four seeds, and two of the top eight, survived to the Australian Open women’s quarter-finals. Many of the top seeds lost early. This feels like a trend, and it isn’t new.

One plausible explanation is that the field keeps getting stronger. Top-level players now develop all over the world, and coaching and training techniques continue to improve. There are few easy, guaranteed matches, even if Iga Swiatek and Aryna Sabalenka usually(!) make it look that way. I believe this is part of the story.

Another component, I suspect, is the shift in playing styles. I noted a couple of weeks ago when writing about Angelique Kerber is that WTA rally lengths have steadily declined in the last decade. In 2013, the typical point lasted 4.7 strokes; it’s now around 4.3. Shorter points are caused by more risk-taking. Risks don’t always work out, full-power shots go astray, and the better-on-paper player doesn’t always win.

In 2019, I tested a similar theory about men’s results. I split players in four quartiles based on Aggression Score and tallied the upset rate for every pair of player types. When two very aggressive players met, nearly 39% of matches resulted in upsets, compared to 25% when two very passive players met. The true gap isn’t quite that big: given the specific players involved, there should have been a few more upsets among the very aggressive group. But even after adjusting for that, it remained a substantial gap.

It stands to reason that the story would be the same for women. Instead of Aggression Score, I used average rally length. I doubt there’s much difference. I didn’t intend to change gears, I just got halfway through the project before checking what I did the first time.

The most aggressive quartile (1, in the table below) are players who average 3.6 shots per rally or less. The next group (2) ranges from 3.7 to 4.0, then (3) from 4.1 to 4.5, and finally (4) 4.6 strokes and up. The following table shows the frequency of upsets (Upset%) and how the upset rate compares to expectations (U/Exp) for each pair of groups:

Q1  Q2  Upset%  U/Exp  
1   1    40.7%   1.07  
2   1    36.2%   0.99  
2   2    35.7%   0.99  
3   1    35.1%   0.93  
3   2    35.5%   0.97  
3   3    40.9%   1.07  
4   1    37.6%   1.03  
4   2    36.6%   1.02  
4   3    34.6%   0.95  
4   4    34.7%   0.97

(If you look back to the 2019 study, you’ll notice that I did almost everything “backwards” this time — swapping 1 for 4 as the label for the most aggressive group, and calculating results as favorite winning percentages instead of upsets. Sorry about that.)

Matches between very aggressive players do, in fact, result in more upsets than expected. It’s not an overwhelming result, partly because it’s only 7% more than expected, and partly because matches between third-quartile players–those with average rally lengths between 4.1 and 4.5–are just as unexpectedly unpredictable.

I don’t know what to make of the latter finding. I can’t think of any reasonable cause for that other than chance, which casts some doubt on the top-line result as well.

If the upset rate for matches between very aggressive players is a persistent effect, it would give us more upsets on tour today than we saw a decade ago. An increasing number of players fit the hyper-aggressive mold, so there are more matchups between them. The logic seems sound to me, though it may be the case that other sources of player inconsistency outweigh a woman’s particular risk profile.

* * *

January 23, 1924: Debuts and dropshots

Men’s tennis ruled at the early Australian Championships. The tournament had been held since 1905 (as the “Australasian” Championships), but there was no women’s singles until 1922. On January 23rd, midway through the 1924 edition, the press corps was preoccupied with the severity of Gerald Patterson’s sprained ankle and the question of whether Ian McInnes had been practicing.

James O. Anderson, the 1922 singles champion who would win the 1924 edition as well, introduced what was then–at least to the Melbourne Argus–an on-court novelty:

He has developed a new stroke since he last played in Melbourne, and it has proved successful. On the back of the court he makes a pretence of sending in a hard drive, but with a delicate flick of the wrist he drops the ball just over the net, leaving his opponent helpless 30 feet away.

A veritable proto-Alcaraz, was James O.

For the few fans who weren’t solely focused on Australia’s Davis Cuppers, a superstar was emerging before their eyes. Also on the 23rd, 20-year-old Daphne Akhurst made quick work of Violet Mather, advancing to the semi-finals in her first appearance at the Championships.

Akhurst wouldn’t go any further, unable to withstand the heavy forehand of Esna Boyd in the next round. But it was nonetheless a remarkable debut: She won both the women’s and the mixed doubles titles. The correspondent for the Melbourne Age, recapping the mixed final, could hardly contain his admiration:

Miss Akhurst–an artist to her finger tips–belied her delicate mid-Victorian appearance that suggested that she had slipped out of one of Jane Austen’s books by sifting out cayenne pepper strokes from a never-failing supply.

Daphne and Jack Willard–“who ran for every ball, and continued running after he played the ball”–defeated Boyd and Gar Hone in straight sets.

The pair of championships was a harbinger of things to come. Between 1925 and 1931, Akhurst would win five singles titles (losing only in 1927 when she withdrew), four more in the women’s doubles, and another three mixed. The only thing that could stop her were the customs of the day: She married in 1930 and retired a year later. Tragically, she died from pregnancy complications in 1933, at the age of 29.

Daphne is best known these days as the name on the Australian Open women’s singles trophy. For the next several years, there will be many more Akhurst centennials to celebrate.

* * *

Subscribe to the blog to receive each new post by email:
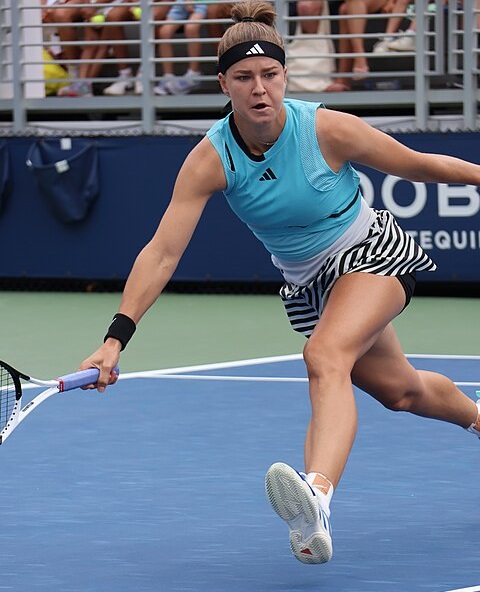
 

Predicting Next Year’s Elo Ratings

I often illustrate the difference between Elo ratings and the traditional ATP and WTA ranking-point systems as follows: The official rankings tell you how good a player was six months ago. Elo estimates where they are today. For the purposes of tournament entry and so on, a 52-week average makes sense. But if you’re predicting the outcome of tomorrow’s match, you don’t want to assign the same weight to a year-old result that you give to yesterday’s news.

That said, Elo ratings are not explicitly predictive. They rely only on past results. They don’t recognize the fact that a player on a hot streak will probably cool off, or that a younger player is more likely to improve than an older one. If we want to look further ahead than tomorrow’s match, we need to take some of those additional factors into account.

Hence today’s project: Projecting Elo ratings one year in advance. Elo ratings tend to be a leading indicator of official rankings, so if we can get some idea of a player’s future in Elo terms, we can estimate–very approximately, I admit–his or her ATP or WTA ranking even further out.

I kept things simple. Each player’s forecast is based on four variables: Age, current Elo rating, rating one year ago, and rating two years ago. Current rating is by far the most important consideration. It accounts for over 70% of the men’s forecast and 80% of the women’s. Everything else is essentially a tweak. The two older ratings allow the forecast to make adjustments if the current rating is an outlier. By including player age, we account for the fact that players over 25 or 26 start–on average!–to decline, and the older they are, the sharper the decline.

Take Novak Djokovic as an example. His current Elo rating is 2,227, one year ago it was 2,145, and two years ago it was 2,186. Because his 2023 year-end rating was higher than 2021 or 2022, we’d expect a small step backwards. And because he’s 36 years old, the laws of physics might eventually slow him down. Put it all together, and the model projects his 2024 year-end Elo at 2,116. Excellent, but slightly more human, and a number that would’ve placed him third on this year’s list.

Here is what the model predicts as the 2024 year-end top ten:

Rank  Player              2024 Elo  2023 Rank  2023 Elo  
1     Jannik Sinner           2144          2      2197  
2     Carlos Alcaraz          2137          3      2149  
3     Novak Djokovic          2116          1      2227  
4     Daniil Medvedev         2059          4      2104  
5     Alexander Zverev        2021          5      2024  
6     Andrey Rublev           1988          6      2020  
7     Stefanos Tsitsipas      1969          9      1974  
8     Holger Rune             1954         12      1936  
9     Hubert Hurkacz          1950          8      1983  
10    Grigor Dimitrov         1928          7      2011

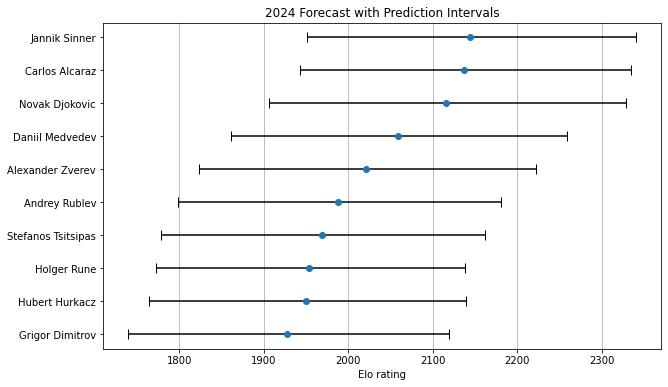
As precise as that table looks, it is hard to predict the future. Here are the same ten players, with a 95% prediction interval shown:

The intervals demonstrate just how uncertain we are, with 12 months of tennis to play. If Jannik Sinner or Carlos Alcaraz hits the high end of his range, in the mid-2,300s, he’ll have established himself as a runaway number one. But if they surprise in the other direction, they’ll land below 2,000 and just barely stay in the top ten. Even these intervals don’t quite account for all the unknowns. There’s a nonzero chance that any of these guys will get hurt and miss most of the season, leaving them off the 2024 year-end list entirely.

I suspect, also, that a more sophisticated model would give a different range of outcomes for Djokovic. There are few precedents for his level of play at age 36, and he outperformed expectations in 2023. Had we run this model a year ago, it would’ve predicted a 2,071 Elo for him now. He beat that by more than 150 points, landing around the 85th percentile of the projection. But time is cruel. Since 1980, five out of six 36-year-olds have seen their Elo decline from the previous season. The average year-over-year change–including those few players who gained–is a loss of 45 points. It’s hard to bet against Djokovic, but at this point in his career, his downside almost certainly exceeds his upside.

Finally, let’s take a look at the projected 2024 top ten on the women’s side. It’s not nearly as juicy as the men’s forecast, as it barely differs from the 2023 list. As I mentioned above, a player’s current rating is a bigger factor in the forecast than it is for men–age is less of a factor, and if a player’s rating jumps around from year to year, women are more likely to stay at their current level than bounce back to a previous one. The forecast:

Rank  Player               2024 Elo  2023 Rank  2023 Elo  
1     Iga Swiatek              2197          1      2237  
2     Cori Gauff               2100          2      2127  
3     Aryna Sabalenka          2062          3      2099  
4     Jessica Pegula           2035          4      2089  
5     Elena Rybakina           2024          5      2059  
6     Marketa Vondrousova      1977          8      2005  
7     Ons Jabeur               1976          7      2007  
8     Karolina Muchova         1965          6      2014  
9     Qinwen Zheng             1961          9      2000  
10    Liudmila Samsonova       1938         11      1959

You might have noticed in both the ATP and WTA lists that most ratings–at least for top-tenners–are projected to go down. There’s a small regression component in the model, meaning that every player is expected to pull a bit back toward the middle of the pack. That doesn’t mean they will, of course, but on average, that’s what happens.

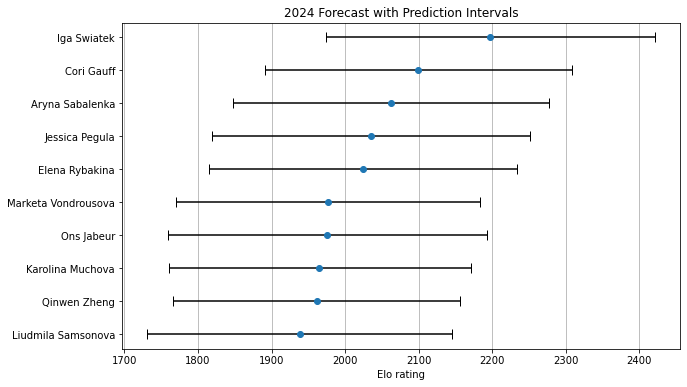
Here are the prediction intervals for the women’s top ten:

The magnitude of the intervals is about the same as it was for the men. Iga Swiatek could launch into a peak-Serena-like stratosphere, or she could, conceivably, land at the fringes of the top ten. Liudmila Samsonova, bringing up the end of this list, might challenge for a place in the top three, or she could be scrambling to stay in the top 50.

One thing is certain: The 2024 year-end lists won’t actually look like this. The value of this sort of forecast, even when it is so approximate, lies in the context it gives us. A year from now, we’ll be talking about which players outperformed or underperformed their expectations. Projections like these help us pin down what, exactly, was a reasonable expectation in the first place.

* * *

I’ll be writing more about analytics and present-day tennis in 2024. Subscribe to the blog to receive each new post by email:
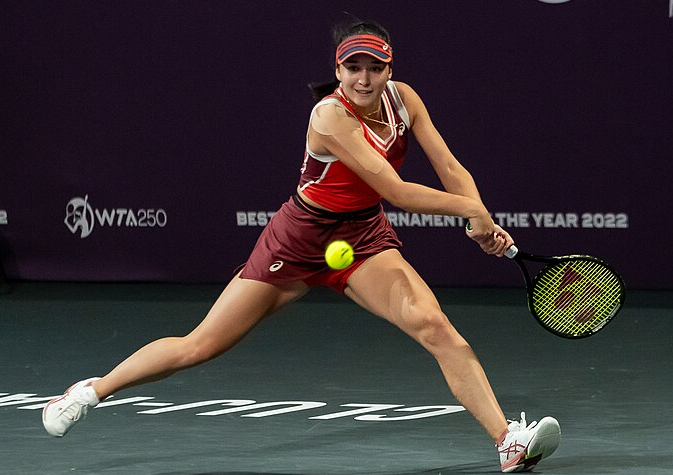
 

Is It Ever Better To Be Unseeded?

As draw-probability takes go, this one is pretty spicy:

Satisfyingly counterintuitive if true. Is it?

A few reasons for skepticism: As an unseeded player, you could get a top-eight seeded opponent in the first round. Or the second. Or, after upsetting a lower seed–you are almost guaranteed to get one in the first or second round–you could still end up with a top-eight seed in the third round. Going into the draw unseeded is hardly protection against a top-eight opponent.

I could theorize further, but why not just delve into the numbers?

The men’s draw

Let’s look at a few examples from the draw. The 25th seed is Nicolas Jarry, who was drawn to face Carlos Alcaraz in the third round (ouch!). His grass-court Elo (gElo)–the number I use to generate forecasts–is 1698.5. The closest unseeded player to him on the gElo list is Adrian Mannarino, who has a rating of 1700.8. In Elo terms, a difference of 2.3 points is basically just a rounding error.

If Ricky’s theory is correct, on the morning of the draw, it was better to be Mannarino than Jarry. Except–oops!–Mannarino was drawn to face third-seed Daniil Medvedev in the second round.

How does all that good and bad luck shake out in the forecast? Jarry has a 7.5% chance of reaching the round of 16, 2.6% for the quarters, and 1.0% for the semis. Mannarino has 6.3% for R16, 3.2% for the quarters, and 1.1% for the semis. Those are awfully close, just like the near-identical gElo ratings would imply. The luck mostly washed out.

(If you look at my forecast after the tournament begins, the numbers will no longer be the same. That’s partly because every result has an effect on many other probabilities, and partly because the gElo ratings will slightly change when I add this week’s results from Eastbourne and Mallorca, which are not yet in the system.)

What about 26th seed Denis Shapovalov? Shapo has a gElo of 1675.1, roughly equal to unseeded Ugo Humbert’s 1676.1. Would it be better to be Ugo?

Shapovalov got lucky: His top-eight counterpart in the draw is Casper Ruud, a not-grass specialist who is barely rated higher than the Canadian. Shapo’s odds of going further than Ruud into the round of 16 are 25.3%. He has a 10.5% chance of making the quarters and a 3.4% shot at the semis.

Humbert was not so lucky. Like Jarry, he’s in Alcaraz’s section. He has a mere 3.5% shot at the fourth round, 1.1% for the quarters, and 0.4% for the finals. The way the cookie crumbled on draw day, it was much better to be Shapo than Ugo.

One more. Dan Evans is the 27th seed, with a gElo of 1693.1. The closest unseeded player in the draw is Sebastian Ofner, gElo-rated 1688.5. Evans lines up for a third-rounder with 8th-seed Jannik Sinner, who is much better than Ruud despite the number next to his name. Despite a tricky first-rounder with Quentin Halys and Sinner looming in the third, Evans’s chances of making the fourth round are 14.5%, along with 6.8% for the quarters and 3.2% for the semis.

By unseeded standards, Ofner got lucky. He drew almost-seeded Jiri Lehecka to open, but the seeds in his section are #18 Francisco Cerundolo and #16 Tommy Paul. With the benefit of that good fortune, his chances of lasting to the second week are 16.0%, with a 4.1% shot at the quarters and a 1.3% chance of a semi-final berth. By the numbers, I’d take Evans’s position over Ofner’s, though it’s pretty close.

So: three anecdotal comparisons, one saying it is definitely better to be the seed, one saying it’s marginally better, one saying it’s about even.

There’s one obvious counter-example. Tomas Martin Etcheverry, seeded 29th, landed in Novak Djokovic’s section. He has a mere 0.8% chance at the fourth round, 0.2% for the quarters, and everything else rounds down to zero. His own rating is part of the problem: He has little experience on grass.

The closest unseeded player in the draw to Etcheverry’s 1585.5 gElo is Daniel Altmaier at 1587.8. Altmaier ended up in the Sinner/Evans section, with an unseeded first-round opponent. His chances of reaching the fourth round are 4.8%, with a 1.5 chance of the quarter-finals.

So we can say one thing for sure: If you know you’ll be drawn to face Djokovic early, you might want to not do that.

The general solution

These are all anecdotes, and the forecasts are entirely dependent on this year’s actual Wimbledon draw. That doesn’t answer the question in any comprehensive way.

We can get closer to a general solution by running two simulations. First, forecast the 2023 Wimbledon field, with the actual seeds, without considering how the draw actually played out. So Etcheverry might have landed in Ruud’s section, or Mannarino might have drawn Djokovic in the first round.

Next, forecast the 2023 Wimbledon field, but instead of keeping the actual seeds, assign the 25th to 32nd seeds to the next eight players in the rankings. Instead of the 25th seed belonging to Jarry, we give it to Lehecka, and Jarry is unseeded, and so on.

By keeping the players constant and varying the seeds, we can see the effect of the seedings on 16 players: the actual seeds 25-32, and the “next eight” who just missed.

Here are the chances of those 16 men reaching the fourth round in the two scenarios, seeded and unseeded:

Player                       R16 Seed  R16 Un  
Nicolas Jarry                   15.3%   13.1%  
Denis Shapovalov                12.8%   11.0%  
Daniel Evans                    15.0%   12.8%  
Tallon Griekspoor               30.5%   28.1%  
Tomas Martin Etcheverry          6.1%    4.9%  
Nick Kyrgios                    20.6%   18.3%  
Alejandro Davidovich Fokina     12.8%   11.0%  
Ben Shelton                      4.4%    3.5%  
Jiri Lehecka                     9.7%    8.0%  
Matteo Berrettini               33.5%   30.9%  
Ugo Humbert                     13.2%   11.4%  
Andy Murray                     31.9%   29.4%  
Lorenzo Sonego                  19.8%   17.5%  
Miomir Kecmanovic                8.1%    6.5%  
Botic van de Zandschulp         14.0%   11.9%  
Adrian Mannarino                15.7%   13.6%

On average, these players have a 16.5% chance of lasting to the second week if they have a seed, 14.5% otherwise.

The same thing holds if we care more about other achievements, like reaching the third round, the quarter-finals, or the semis:

            R32    R16    QF    SF  
Seeded    40.5%  16.5%  8.4%  3.8%  
Unseeded  28.7%  14.5%  6.9%  3.1%

It’s better to be seeded.

Going wide

This isn’t a truly general solution, because it is based solely on the 2023 Wimbledon men’s field. You might think of this group of players as top-heavy, which would make it more valuable to avoid the top seeds. But while Djokovic and Alcaraz are well ahead of the pack, the top eight as a whole is not overwhelming dominant–just think of Ruud on grass.

We could construct a variety of other draws with different mixes of ability levels. You could imagine a field in which the top eight players were all outstanding and the rest were not. An extreme example like that might change the results. We’ll save that for another day. In the meantime, players: Keep chasing those seeds.

* * *

Subscribe to the blog to receive each new post by email:
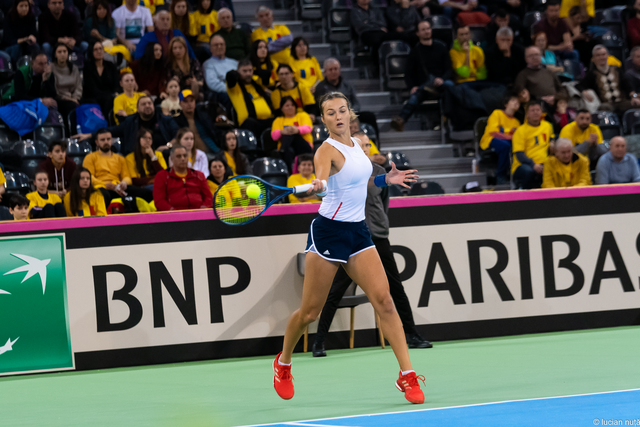
 

Are Conditions Slower? Faster? Weirder?

Many players didn’t like the conditions at Roland Garros this year. The clay, apparently, was slower and heavily watered, at least on some courts. The balls were heavier than usual, especially when they had been in play for a little while and the clay began to stick to them.

Maybe the courts really did play differently. We could compare ace rate, rally length, or a few other metrics to see whether the French played slower this year.

I’m interested in a broader question. Were the conditions weirder? To put it another way, were they outside the normal range of variation on tour? We could be talking about anything that impacts play, including surface, balls, weather, you name it.

This is surprisingly easy to test. The weirder the conditions, the more unpredictable the results should be. If you don’t get the connection, think about really strange conditions, like playing in mud, or in the dark, or with rackets that have broken strings. In those situations, the factors that determine the winner of a match are so different than usual that they will probably seem random. At the very least, there will be more upsets. Holding a top ranking in “normal” tennis doesn’t mean as much in “dark” tennis or “broken string” tennis. While unusually heavy balls don’t rank up there with my hypotheticals, the idea is the same: The more you deviate from typical conditions, the less predictable the results.

We measure predictability by taking the Brier score of my Elo-based pre-match forecasts. Elo isn’t perfect, but it’s pretty good, and the algorithm allows us to compare seasons and tournaments against each other. Brier score tells us the calibration of a group of predictions: Were they correct? Did they have the right level of confidence? The lower the score, the better the forecast. Or put another way, for our purposes today: The lower the score, the more predictable the outcomes.

Conclusion: This year’s French wasn’t that weird. Here are the Brier scores for men’s and women’s completed main draw matches, along with several other measures for context:

Tourney(s)     Men  Women  
2023 RG      0.177  0.193  
2022 RG      0.174  0.189  
2021 RG      0.177  0.194  
2020 RG      0.200  0.230  
2000-23 RG   0.169  0.184  
00-23 Slams  0.171  0.182  
Min RG       0.133  0.152  
Max RG       0.214  0.230

(“Min RG” and “Max RG” show the lowest and highest tournament Brier scores for each gender at the French since 2000.)

Again, lower = more predictable. For both men and women, the 2023 French was no more upset-ridden than the 2021 edition, and it ran considerably closer to script than the zany Covid tournament in autumn 2020. The results this year were a bit more unpredictable than the typical major since 2000. But the metrics tell us that the outcomes were closer to the average than to the extremes.

However unusual the conditions at Roland Garros felt to the players, the weirdness didn’t cause the results to be any more random than usual. While adjustments were surely necessary, most players were able to make them, and to similar degrees. The best players–based on their demonstrated clay-court prowess–tended to win, about as often as they always do at the French.

Picking 32 Qualifiers

Australian Open qualifying starts in just a few hours. 128 men and 128 women stand three wins away from a spot in a grand slam main draw. Only 16 of each will remain at the end of the week.

Forecasting is particularly tricky during qualifying. Unlike most tournaments, when the top seeds far outrank the field, there’s little difference between a player on the fringes of the top 100 and one in the middle of the 200s. Andrej Martin, the top seed in the men’s qualifying draw, has the lowest hard-court Elo rating of the eight players in his section!

Let’s run through the 32 eight-player sections. I’ve posted pre-tournament forecasts for men and women. Keep in mind that these numbers don’t (yet) include any results from the week of January 3rd. For most players it doesn’t matter. For a few, like Melbourne semi-finalist Qinwen Zheng, it misses a major ranking boost.

To make things more interesting, let’s compare Elo’s preferences to those of two guys who pay more attention to Challenger-level tennis than I do, Alex Gruskin* and Damian Kust. At the end of the week, we’ll see how the experts fared against the machine. Unless, of course, they make the machine look bad, in which case I’ll delete this post and deny this ever happened.

Men’s qualifying draw

  1. Mikhail Kukushkin. Elo likes the veteran, giving him a 22.9% chance of qualifying. Damian picks NCAA star and 2021 breakout Nuno Borges (Elo: 13.7%), while Alex prefers big-hitting American Ernesto Escobedo (Elo: 16.9%, which will be higher after the algorithm includes EE’s challenger win this week.) Top seed Andrej Martin could hardly be a longer shot.
  2. Mats Moraing (23.9%). Both of our experts like Dominic Stricker (10.8%), the 19-year-old Swiss. Damian acknowledges a bit of wishful thinking here.
  3. Maximilian Marterer (29.6%). Elo prefers alliterative German names. Damian agrees, while Alex goes with the high seed in the section, #3 Daniel Galan (12.7%).
  4. Gilles Simon (34.1%). Gilles Simon is playing grand slam qualifying! Damian and Alex are both too young to remember Simon’s prime, which explains their pick of Tomas Machac (23.4%).
  5. Joao Sousa (31.7%). Damian agrees. Alex boldly picks Geoffrey Blancaneaux (5.7%), the fifth favorite in the section according to Elo.
  6. Jiri Lehecka (23.9%). Another vote of confidence from Damian. Alex picks Michael Mmoh (11.7%) for the first-round upset of the higher-ranked Lehecka.
  7. Salvatore Caruso (28.2%). Shockingly, Alex is finally on board with an Elo pick. Damian prefers the top seed in the section, #7 Taro Daniel (23.2%).
  8. Quentin Halys (21.6%). The most even section we’ve seen so far. Damian concurs, calling him “underrated,” while Alex goes with Yannick Hanfmann (18.1%).
  9. Damir Dzumhur (27.9%). Both of our experts go with Rinky Hijikata (1.1%). Rinky is the hipster pick, but he did get broken four times by Maxime Cressy this week.
  10. Christopher Eubanks (30.5%). I really thought we’d see Alex agree with Elo here, since the algorithm finally picked an American. But no, Gruskin goes with the formerly mulleted JJ Wolf (25.1%). Damian prefers Roman Safiullin (5.8%), the surprise star of Russia’s ATP Cup squad. It worked for Aslan Karatsev
  11. Hugo Grenier (31.8%). Damian agrees, while Alex goes with Juan Pablo Varillas (4.6%), a man who last won a main draw match on hard in 2019 at an ITF M15 in Cancun. Another “bold” pick from the intrepid podcaster.
  12. Jason Kubler (29.9%). We all agree!
  13. Frederico Ferriera Silva (23.4%). Alex goes with basically-tied-as-favorite Mitchell Krueger (23.1%), and Damian goes with a personal fave in Nicola Kuhn (6.8%).
  14. Alexandre Muller (24.1%). Both experts pick Jurij Rodionov (23.7%), the top seed in the section and practically a co-favorite per Elo.
  15. Cem Ilkel (20.6%). Damian correctly pegs this as a very balanced section–Ilkel is the least Elo-favored pick of the 16. Both Damian and Alex go with Zizou Bergs, a likeable player by humans, but apparently not by the machine (8.3%).
  16. Alejandro Tabilo (32.0%). We all agree! I’m guessing both experts were tired at this point, so we all just went with the top seed.

We all agreed on two picks, and we all picked different players in three sections. Of the rest, Damian and Alex voted the same way five times, Damian went with the Elo pick five times, and Alex agreed with Elo once.

Women’s qualifying draw

Damian focuses on the men’s game, so here we have only two sets of forecasts: Elo and Alex Gruskin’s picks, along with a few of my personal preferences where they differ from the algorithm.

The gap between the seeds and field is much greater in the women’s game, hence the much higher probabilities that many of the top seeds (and/or Elo’s choices) reach the main draw.

  1. Anna Kalinskaya (63.8%). Everyone’s on the same page here, even Nick Kyrgios.
  2. Martina Trevisan (47.6%). Alex picks the clear second favorite, Olga Govortsova (27.0%).
  3. Lin Zhu (45.6%). Again, Alex goes with the second fave, Anna Blinkova (25.5%).
  4. Nina Stojanovic (42.2%). I’ll be cheering for Caty McNally (27.7%), even if wouldn’t put my money against Elo. Alex picks another American, Hailey Baptiste (8.4%).
  5. Mariam Bolkvadze (26.1%). Sometimes it seems that Elo is trolling us, like this pick of an unseeded Georgian. Alex goes with Bolkvadze’s first-round opponent, Irina Maria Bara (9.8%), so at least one of the choices will be eliminated quickly.
  6. Lesia Tsurenko (54.7%). Alex agrees. My sentimental fave, as always, is Kathinka von Deichmann (3.7%), who I know better than to actually pick.
  7. Katie Boulter (40.6%). And sometimes it feels like Gruskin is trolling us. In a section with Boulter and Christina McHale (26.8%), he goes with Francesca Di Lorenzo (5.1%).
  8. Kateryna Bondarenko (26.0%). A balanced section, where Alex goes with the top seed, Kamilla Rakhimova. If Damian had projected this draw, he’d surely make a wishful pick of Victoria Jimenez Kasintseva (6.4%), 16-year-old runner-up in Bendigo this week.
  9. Rebeka Masarova (32.8%). I can only assume Alex is drinking heavily by this point, as he picked Kurumi Nara (13.0%) over both Masarova and top seed Sara Errani (28.7%). My only pick is that Errani reaches at least double digits in underhand serves.
  10. Mihaela Buzarnescu (30.3%). Alex picks Jule Niemeier, who at 30.0% is Elo’s co-favorite. I’d love to see Miki launch a comeback in 2022, but she has a tricky first match against Bendigo champ Ysaline Bonaventure, and Niemeier is clearly the rising star here.
  11. Harriet Dart (44.7%). Alex agrees, and in an uninspiring section, I’m guessing some of Harriet’s competitors do too.
  12. Dalma Galfi (35.2%). The second-favorite is Stefanie Voegele (30.3%), and that’s the player both Alex and I expect to see playing in the main draw.
  13. CoCo Vandeweghe (35.0%). It’s an absolute blockbuster of a first-round match (by qualifying standards, anyway) between Vandeweghe and Qinwen Zheng (16.8%). As noted above, Zheng reached the semis in Melbourne, so Elo will think more highly of her as soon as those results are included. It probably won’t swing things all the way in her favor, though–CoCo also reached a semi at the ITF W60 in Bendigo. Meanwhile, Alex is now doing vodka shots and picks Mai Hontama (13.9%).
  14. Aleksandra Krunic (26.3%). Another very even section. Alex goes with Cristina Bucsa (17.2%), while to me it looks like it’s Anna-Lena Friedsam’s (19.3%) main-draw spot to lose.
  15. Elisabetta Cocciaretto (36.7%). Every once in a while someone tries to explain to me how players could manipulate Elo ratings, if it matters. I don’t really buy the argument, but if anyone could game the system, it’s Cocciaretto. She seems to be doing it already. I don’t understand why she’s the favorite here, and I’m not sure I would even pick her in the first rounder against Lara Arruabarrena. Alex goes with the safe pick here, top seed Nao Hibino (20.7%).
  16. Aliona Bolsova (30.2%). Tons of talent in the bottom section, with Viktoria Kuzmova (24.6%), last year’s discovery Francesca Jones (12.1%), and local slugger Destanee Aiava (2.4%). Alex takes the top seed here, Anastasia Gasanova (12.6%).

Qualifying really is anybody’s game. According to my traffic logs, Alex visits my Elo ranking pages even more often than the Russian spambots do, and we still only agree on 3 of 16 picks.

Thanks to Damian and Alex for letting me including their picks here.

* Full disclosure: Alex and I are both members of the board of directors of the Serena Williams Power Tennis Country Club. As tennis insiders, it’s only natural that we have a conflict of interest.

The Best at Getting Better

Here’s a stat you probably didn’t know*. Since the restart, the WTA top five in first-serve points won are Naomi Osaka, Serena Williams, Ashleigh Barty, Jennifer Brady, and … Maria Sakkari.

** unless you’ve been listening to me podcast lately.

The first four names are to be expected: Osaka, Williams, and Barty are probably the top three offensive players in the game, period, and Brady makes her money with big serving. Sakkari is the one who stands out. She does many things well, but I would never have thought to put her in this group, ahead of the likes of Karolina Pliskova, Aryna Sabalenka and, well, everybody else.

Sakkari’s first serve might be the best-kept secret in the women’s game, in large part because it hasn’t been around to keep secret for long. When she started playing tour events, her serve was quite weak, and it has only gradually improved since then. That’s what I marvel at. In six seasons at tour level, all with at least 18 matches played, here are her rates of first-serve points won:

Year     1st Win%  
2016        58.6%  
2017        59.7%  
2018        63.7%  
2019        65.2%  
2020        66.5%  
2021        69.9%

This probably doesn’t need further explanation. Fewer than 60% of first serve points isn’t very good, 70% is excellent, and improving from one to the other is a massive accomplishment. But in case you’re not convinced, here’s the same progression along with percentile rankings, showing that Sakkari started her career better than only 13% of her peers, and this year is outperforming 93% of them:

Year     1st Win%  Percentile  
2016        58.6%          13  
2017        59.7%          20  
2018        63.7%          53  
2019        65.2%          67  
2020        66.5%          79  
2021        69.9%          93

Players can and do improve, but they usually retain the same relative strengths and weaknesses throughout their career. The Greek star has broken that mold, and there’s a natural follow-up question: Has there been anyone else like her?

Meet Kiki

Here’s the simple filter I used to identify players who had substantially improved this aspect of their game. For every player with a full season in which they won fewer than 60% of first-serve points (almost exactly the 20th percentile), I identified those who eventually recorded a full-season in the top half of WTA players, roughly 63.3% or better.

From 2010 to 2021–yes, an awfully short span, due to the limited availability of historical WTA match stats–112 different players posted a sub-60% season. 26 of them went on to an above-average year. One example is Carla Suarez Navarro, who won 59.0% of first-serve points in 2010, and peaked at 64.0% (56th percentile) in 2016. That’s a respectable progression, but far from Sakkari’s standard.

Here are the 10 players who improved on a sub-60% season to eventually manage a season of 65% or better, ranked by the best level they attained:

Player       Weak   1st%  %ile  Strong   1st%  %ile  
K Bertens    2015  59.5%    18    2019  71.9%    97  
M Sakkari    2016  58.6%    13    2021  69.9%    93  
D Kasatkina  2017  59.0%    15    2021  66.4%    78  
S Halep      2012  56.4%     3    2014  66.4%    78  
Y Shvedova   2011  59.4%    17    2016  66.1%    75  
A Cornet     2011  58.9%    14    2020  66.1%    75  
M Linette    2016  59.9%    21    2020  65.8%    73  
Y Wickmayer  2012  60.0%    22    2017  65.8%    72  
A Sasnovich  2016  58.4%    11    2018  65.1%    67  
S Stephens   2011  59.7%    19    2015  65.0%    66

Kiki Bertens wasn’t quite as bad as Sakkari at her worst, but she wasn’t getting much benefit from her first serve. Like the Greek, she had back-to-back seasons below 60%, but unlike Sakkari, her improvement was instant. She leapt from sub-60% in 2015 to almost 68% (86th percentile) a year later. You won’t be surprised to hear that her ranking catapulted upwards as well, from 104th at the end of 2015 to 22nd a year later.

Kiki’s several years since also bode well for Sakkari. Her first-serve winning percentage of 67.4% last year was her worst since crossing the 60% barrier. A slightly less optimistic story comes from Simona Halep, whose 78th percentile mark in 2014 remains her career best. Coming from such an abysmal starting point, it’s remarkable that Halep has improved as much as she has, but she remains firmly in the range of good-but-not-great in this dimension of her game.

Steady improvements

There’s no particular advantage to spreading out one’s gains over a half-decade, like Sakkari has. If she had been given the option of picking up eight percentage points in a single year, like Bertens did, she would’ve taken it.

Still, the fact that the Greek keeps marching upwards is what makes her ascent so fascinating to me. In the decade-plus of data available, no other woman has improved her first-serve win percentage for five years running. Only two players–Yulia Putintseva and Saisai Zheng–have enjoyed positive bumps for four consecutive seasons, and neither situation really compares. Zheng’s improvement took her from 53.2% in 2015 to 59.3% in 2019, and Putintseva rose from 57.9% in 2017 to 62.4% so far this year. While both are making the most of what they have, neither has fundamentally transformed the type of threat they bring on court the way that Sakkari has.

In search of a better comparison–any comparison–with this five-year streak of gains, I turned to the more extensive set of ATP match stats, which go back to 1991. In those three decades, I found exactly 10 players who improved in this department for five (or more) consecutive years. It’s a decidedly diverse group, with a few names you might recognize:

Player            Streak  Start %ile  End %ile  
Renzo Furlan           6           2        73  
Slava Dosedel          6           2        16  
Julien Benneteau       5          16        55  
Arnaud Clement         6          18        70  
Michael Chang          5          18        92  
Roger Federer          5          47        94  
Thomas Enqvist         5          58        94  
Boris Becker           6          79        99  
John Isner             7          82        98  
Marc Rosset            5          87        98 

The starting and ending percentiles indicate that this list includes players who began bad and ended a bit less bad, servebots who started great and eked even more out of their biggest weapon, and then a handful of Sakkari-esque figures who steadily went from considerably below average to far above it.

Michael Chang is the closest parallel of the group, even if we don’t have complete match stats for the first few years of his career. In 1991 he was one of the best returners in the game, but winning barely two thirds of his first serve points wasn’t enough to keep him in the top ten in an offense-dominated era. Five years later he was winning 77% of his first deliveries and ended the season at his peak ranking of #2. He couldn’t sustain the elite-level serving stats, but he did have a few more above-average years.

And then there’s Roger Federer. I’ll leave it to Sakkari fans to work out whether his presence on this list can tell us anything about her future.

Ave Maria

This is all just a long way of saying “wow!” There are other aspects of Sakkari’s game that she has improved, though none so consistently and dramatically. Once you start looking at year-to-year trends for individual stats, future projects start to multiply: identifying peak ages for different parts of the game, determining which stats are more or less likely to regress to the mean, finding which ones best predict ranking climbs, and so on.

We’ll get to some of those answers eventually. In the meantime, I’ll be watching Sakkari with new, better-informed eyes.

So, About Those Stale Rankings

Both the ATP and WTA have adjusted their official rankings algorithms because of the pandemic. Because many events were cancelled last year (and at least a few more are getting canned this year), and because the tours don’t want to overly penalize players for limiting their travel, they have adopted what is essentially a two-year ranking system. For today’s purposes, the details don’t really matter–the point is that the rankings are based on a longer time frame than usual.

The adjustment is good for people like Roger Federer, who missed 14 months and is still ranked #6. Same for Ashleigh Barty, who didn’t play for 11 months yet returned to action in Australia as the top seed at a major. It’s bad for young players and others who have won a lot of matches lately. Their victories still result in rankings improvements, but they’re stuck behind a lot of players who haven’t done much lately.

The tweaked algorithms reflect the dual purposes of the ranking system. On the one hand, they aim to list the best players, in order. On the other hand, they try to maintain other kinds of “fairness” and serve the purposes of the tours and certain events. The ATP and WTA computers are pretty good at properly ranking players, even if other algorithms are better. Because the pandemic has forced a bunch of adjustments, it stands to reason that the formulas aren’t as good as they usually are at that fundamental task.

Hypothesis

We can test this!

Imagine that we have a definitive list, handed down from God (or Martina Navratilova), that ranks the top 100 players according to their ability right now. No “fairness,” no catering to the what tournament owners want, and no debates–this list is the final word.

The closer a ranking table matches this definite list, the better, right? There are statistics for this kind of thing, and I’ll be using one called the Kendall rank correlation coefficient, or Kendall’s tau. (That’s the Greek letter τ, as in Τσιτσιπάς.) It compares lists of rankings, and if two lists are identical, tau = 1. If there is no correlation whatsoever, tau = 0. Higher tau, stronger relationship between the lists.

My hypothesis is that the official rankings have gotten worse, in the sense that the pandemic-related algorithm adjustments result in a list that is less closely related to that authoritative, handed-down-from-Martina list. In other words, tau has decreased.

We don’t have a definitive list, but we do have Elo. Elo ratings are designed for only one purpose, and my version of the algorithm does that job pretty well. For the most part, my Elo formula has not changed due to the pandemic*, so it serves as a constant reference point against which we can compare the official rankings.

* This isn’t quite true, because my algorithm usually has an injury/absence penalty that kicks in after a player is out of action for about two months. Because the pandemic caused all sorts of absences for all sorts of reasons, I’ve suspended that penalty until things are a bit more normal.

Tau meets the rankings

Here is the current ATP top ten, including Elo rankings:

Player       ATP  Elo  
Djokovic       1    1  
Nadal          2    2  
Medvedev       3    3  
Thiem          4    5  
Tsitsipas      5    6  
Federer        6    -  
Zverev         7    7  
Rublev         8    4  
Schwartzman    9   10  
Berrettini    10    8

I’m treating Federer as if he doesn’t have an Elo rating right now, because he hasn’t played for more than a year. If we take the ordering of the other nine players and plug them into the formula for Kendall’s tau, we get 0.778. The exact value doesn’t really tell you anything without context, but it gives you an idea of where we’re starting. While the two lists are fairly similar, with many players ranked identically, there are a couple of differences, like Elo’s higher estimate of Andrey Rublev and its swapping of Diego Schwartzman and Matteo Berrettini.

Let’s do the same exercise with a bigger group of players. I’ll take the top 100 players in the ATP rankings who met the modest playing time minimum to also have a current Elo rating. Plug in those lists to the formula, and we get 0.705.

This is where my hypothesis falls apart. I ran the same numbers on year-end ATP rankings and year-end Elo ratings all the way back to 1990. The average tau over those 30-plus years is about 0.68. In other words, if we accept that Elo ratings are doing their job (and they are indeed about as predictive as usual), it looks like the pandemic-adjusted official rankings are better than usual, not worse.

Here’s the year-by-year tau values, with a tau value based on current rankings as the right-most data point:

And the same for the WTA, to confirm that the result isn’t just a quirk of the makeup of the men’s tour:

The 30-year average for women’s rankings is 0.723, and the current tau value is 0.764.

What about…

You might wonder if the pandemic is wreaking some hidden havoc with the data set. Remember, I said that I’m only considering players who meet the playing time minimum to have an Elo rating. For this purpose, that’s 20 matches over 52 weeks, which excludes about one-third of top-100 ranked men and closer to half of top-100 women. The above calculations still consider 100 players for year-end 2020 and today, but I had to go deeper in the rankings to find them. Thus, the definition of “top 100” shifts a bit from year-end 2019 to year-end 2020 to the present.

We can’t entirely address this problem, because the pandemic has messed with things in many dimensions. It isn’t anything close to a true natural experiment. But we can look only at “true” top-100 players, even if the length of the list is smaller than usual for current rankings. So instead of taking the top 100 qualifying players (those who meet a playing time minimum and thus have an Elo ranking), we take a smaller number of players, all of whom have top-100 rankings on the official list.

The results are the same. For men, the tau based on today’s rankings and today’s Elo ratings is 0.694 versus the historical average of 0.678. For women, it’s 0.721 versus 0.719.

Still, the rankings feel awfully stale. The key issue is one that Elo can’t help us solve. So far, we’ve been looking at players who are keeping active. But the really out-of-date names on the official lists are the ones who have stayed home. Should Federer still be #6? Heck if I know! In the past, if an elite player missed 14 months, Elo would knock him down a couple hundred points, and if that adjustment were applied to Fed now, it would push down tau. But there’s no straightforward answer for how the inactive (or mostly inactive) players should be rated.

What we’ve learned today

This is the part of the post where I’m supposed to explain why this finding makes sense and why we should have suspected it all along. I don’t think I can manage that.

A good way to think about this might be that there is a sort of tour-within-a-tour that is continuing to play regularly. Federer, Barty, and many others haven’t usually been part of it, while several dozen players are competing as often as they can. The relative rankings of that second group are pretty good.

It doesn’t seem quite fair that Clara Tauson is stuck just inside the top 100 while her Elo is already top-50, or that Rublev remains behind Federer despite an eye-popping six months of results while Roger sat at home. And for some historical considerations–say, weeks inside the top 50 for Tauson or the top 5 for Rublev–maybe it isn’t fair that they’re stuck behind peers who are choosing not to play, or who are resting on the laurels of 18-month-old wins.

But in other important ways, the absolute rankings often don’t matter. Rublev has been a top-five seed at every event he’s played since late September except for Roland Garros, the Tour Finals, and the Australian Open, despite never being ranked above #8. When the tour-within-a-tour plays, he is a top-five guy. The likes of Rublev and Tauson will continue to have the deck slightly stacked against them at the majors, but even that disadvantage will steadily erode if they continue to play at their current levels.

Believing in science as I do, I will take these findings to heart. That means I’ll continue to complain about the problems with the official rankings–but no more than I did before the pandemic.

Do Players Like Daniil Medvedev Eventually Start Winning on Clay?

Daniil Medvedev is within a whisker of the ATP number two ranking, and he has twice reached a grand slam final. He has a big serve, but he’s more than a serve-bot, and his resourceful, varied baseline game suggests he has the tools to excel on all surfaces.

Yet out of 28 career tour-level matches on clay, he’s won 10. Ten wins is an awfully meager haul for a 25-year-old with his sights set on the sport’s top honors.

I put together a list of about 140 ATP top-tenners–that’s basically all of them, with the exception of those whose careers were well underway at the start of the Open Era. For each one, I tallied up their clay court winning percentage in their first 28 matches (or 29 or 30, if the 28th came in the middle of an event), their hard-court results up to the same point in their career, and their eventual clay court results.

When Medvedev played his most recent match on dirt last September, it dropped his clay winning percentage to 35.7%, compared to a hard court record of 116-51, or 69.5%. Few top ATPers have begun their careers so ineffective on clay or so deadly on hard.

In fact, only 5 of the 140 players were worse in their first 28 clay matches. It’s a motley bunch, ranging from Joachim Johansson (who only played 17 matches on the surface in his career) to Kevin Curren (who only got there at age 34) to Diego Schwartzman, who is best on clay, but was overmatched early in his career. The guys tied with Medvedev are an equally mixed crowd, including those who preferred to skip the clay–Tim Henman, Paradorn Srichaphan–and those who took some time to get their footing at tour level, such as Nicolas Almagro and Robin Soderling.

Unlike Daniil Medvedev

This sampling of names suggests that the question I started with is difficult to define. On paper, Henman was “like” Medvedev. By the time he finished his 28th clay match, he had already played 152 times at tour level on hard courts, winning two thirds of them. But their playing styles are so different that the statistical similarities could be misleading.

Let’s narrow the list of comparable players to those who meet the following criteria:

  • lost more than half of their first 28 clay matches
  • had played at least 75 hard-court matches by the time they played their 28th on clay (in other words, they weren’t slow-starting dirtballers like Schwartzman or Almagro)
  • played at least 40 more clay-court matches in their careers (to exclude the blatant clay-avoiders like Curren and Srichaphan)

The following table shows the remaining 14 players, plus Medvedev. I’ve included the age when they played their 28th clay match, and their winning percentages on clay and hard up to that point. The final three columns show how things proceeded from there–after the tournament when they played they 28th clay match (“Future”), you can see how many clay matches they played, what percentage they won, and how many titles they took home:

Player        Age  Clay%  Hard%  Future: M   W%  Titles  
T Johansson  24.1    29%    56%         79  38%       0  
Soderling    21.7    34%    53%        109  70%       3  
Henman       24.7    34%    66%         90  59%       0  
Medvedev     24.6    36%    69%                          
Enqvist      22.1    39%    67%         93  51%       1  
Federer      19.8    41%    62%        266  80%      11  
Rafter       24.4    41%    60%         41  59%       0  
Cilic        20.5    43%    64%        174  65%       2  
Anderson     25.9    43%    60%         80  56%       0  
Isner        25.9    45%    60%        100  57%       1  
Kiefer       21.9    45%    62%         94  45%       0  
Blake        23.4    46%    56%         72  46%       0  
Murray       21.9    48%    76%        125  74%       3  
Bjorkman     25.1    48%    60%         71  31%       0  
Rusedski     24.0    48%    54%         50  30%       0

The results don’t exactly leave Rafael Nadal quaking in his Nikes. 8 of the 14 never won a clay title, and Isner’s 2013 win in Houston barely saves him from making it 9. The combined post-28th-match winning percentage of these guys is just shy of 60%, which isn’t bad, until you consider that without Roger Federer, the rate drops to 55%. The four players that offer some hope for Medvedev–Federer, Soderling, Andy Murray, and Marin Cilic–all played their 28th tour-level match on clay before their 22nd birthday, and even given their relative inexperience, all but Soderling did better in their first 28 than the Russian did.

When we take age into consideration, Henman looks like an even better comp, alongside characters like Pat Rafter and Greg Rusedski. They were more obviously one-dimensional than Medvedev is, but their early-career results offer decent parallels. Medvedev can only hope the similarities end there.

One thing I learned in putting together this list was probably already obvious to most of you–there aren’t a lot of players, now or in the past, who can easily be described as “like” Daniil Medvedev. That makes forecasting even trickier than usual. His height and recent serving prowess almost classes him with Isner and Kevin Anderson, while his game style puts him in a category with … Murray?

There’s another lesson in trying to locate parallels for Medvedev. He’d better hope that he continues to defy easy classification. It’s a bit late to become the next Federer, so if he’s going to become more an occasional threat on dirt, he’ll have a whole lot of historical precedent to overcome.

How Much Does Naomi Osaka Raise Her Game?

You’ve probably heard the stat by now. When Naomi Osaka reaches the quarter-final of a major, she’s 12-0. That’s unprecedented, and it’s especially unexpected from a player who doesn’t exactly pile up hardware outside of the hard court grand slams.

It sure looks like Osaka finds another level as she approaches the business end of a major. Translated to analytics-speak, “she raises her game” can be interpreted as “she plays better than her rating implies.” That is certainly true for Osaka. She has won 16 of her 18 matches in the fourth round or later of a slam, often in matchups that didn’t appear to favor her. In her first title run, at the 2018 US Open, my Elo ratings gave her 36%, 53%, 46%, and 43% chances of winning her fourth-round, quarter-final, semi-final, and final-round matches, respectively.

Had Osaka performed at her expected level for each of her 18 second-week matches, we’d expect her to have won 10.7 of them. Instead, she won 16. The probability that she would have won 16 or more of the 18 matches is approximately 1 in 200. Either the model is selling her short, or she’s playing in a way that breaks the model.

Estimating lift

Osaka’s results in the second week of slams are vastly better than the other 93% or so of her tour-level career. It’s possible that it’s entirely down to luck–after all, things with a 0.5% chance of happening have a habit of occurring about 0.5% of the time, not never. When those rare events do take place, onlookers are very resourceful when it comes to explaining them. You might believe Osaka’s claims about caring more on the big stage, but we should keep in mind that whenever the unlikely happens, a plausible justification often follows.

Recognizing the slim possibility that Osaka has taken advantage of some epic good luck but setting it aside, let’s quantify how good she’d have to be for such a performance to not look lucky at all.

That’s a mouthful, so let me explain. Going into her 16 second-week slam matches, Osaka’s average surface-blended Elos have been 2,022. That’s good but not great–it’s a tick below Aryna Sabalenka’s hard-court Elo rating right now. Those modest ratings are how we come up with the estimate that Osaka should’ve won 10.7 of her 18 matches, and that she had a 1-in-200 shot of winning 16 or more.

2,022 doesn’t explain Osaka’s success, so the question is: What number does? We could retroactively boost her Elo rating before each of those matches by some amount so that her chance of winning 16-plus out of 18 would be a more believable 50%. What’s that boost? I used a similar methodology a couple of years ago to quantify Rafael Nadal’s feats at his best clay court events, another string of match wins that Elo can’t quite explain.

The answer is 280 Elo rating points. If we retroactively gave Osaka an extra 280 points before each of these 16 matches, the resulting match forecasts would mean that she’d have had a fifty-fifty chance at winning 14 or more of them. Instead of a pre-match average of 2,022, we’re looking at about 2,300, considerably better than anyone on tour right now. (And, ho hum, among the best of all time.) A difference of 280 Elo points is enormous–it’s the difference between #1 and #22 in the current hard-court Elo rating.

Osaka versus the greats

I said before that Osaka’s 12-0 is unprecedented. Her 16-2 in slam second weeks may not have quite the same ring to it, but compared to expectations based on Osaka’s overall tour-level performance, it is every bit as unusual.

Take Serena Williams, another woman who cranks it up a notch when it really matters. Her second-week record, excluding retirements, is 149-39, while the individual forecasts before each match would’ve predicted about 124-64. The chances of a player outperforming expectations to that extent are basically zero. I ran 10,000 simulations, and that’s how many times a player with Serena’s pre-match odds won 147 of the 185 matches. Zero.

For Serena to have had a 50% chance of winning 149 of the 188 second-week contests, her pre-match Elo ratings would’ve had to have been 140 points higher. That’s a big difference, especially on top of the already stellar ratings that she has maintained throughout her career, but it’s only half of the jump we needed to account for Osaka’s exploits. Setting aside the possibility of luck, Osaka raises her level twice as much as Serena does.

One more example. Monica Seles won 70 of her 95 second-week matches at slams, a marked outperformance of the 60 matches that Elo would’ve predicted for her. Like Osaka, her chances of having won 70 instead of 60 based purely on luck are about 1 in 100. But you can account for her actual results by giving her a pre-match Elo bonus of “only” 100 points.

The full context

I ran similar calculations for the 52 women who won a slam, made their first second-week appearance in 1958 or later, and played at least 10 second-week matches. They divide fairly neatly into three groups. 18 of them have career second-week performances that can easily be explained without recourse to good luck or level-raising. In some cases we can even say that they were unlucky or that they performed worse than expected. Ashleigh Barty is one of them: Of her 14 second-week matches, she was expected to win 9.9 but has tallied only 8.

Another 16 have been a bit lucky or slightly raised their level. To use the terms I introduced above, their performances can be accounted for by upping their pre-match Elo ratings by between 10 and 60 points. One example is Venus Williams, who has gone 84-43 in slam second weeks, about six wins better than her pre-match forecasts would’ve predicted.

That leaves 18 players whose second-week performances range from “better than expected” to “holy crap.” I’ve listed each of them below, with their actual wins (“W”), forecasted wins (“eW”), probability of winning their actual total given pre-match forecasts (“p(W)”), and the approximate number of Elo points (“Elo+”) which, when added to their pre-match forecasts, would explain their results by shifting p(W) up to at least 50%.

Player               M    W     eW   p(W)  Elo+  
Naomi Osaka         18   16   10.7   0.5%   280  
Billie Jean King   123   94   76.2   0.0%   160  
Sofia Kenin         10    7    4.7  10.6%   150  
Serena Williams    188  149  124.4   0.0%   140  
Evonne Goolagong    92   69   58.7   0.4%   130  
Jennifer Capriati   70   42   33.2   1.2%   110  
Monica Seles        95   70   60.2   1.2%   100  
Hana Mandlikova     75   49   41.7   3.1%   100  
Kim Clijsters       67   47   40.6   4.6%    90  
Justine Henin       74   55   48.9   6.3%    80  
Mary Pierce         55   28   22.4   6.9%    80  
Li Na               36   22   18.0  10.6%    80  
Steffi Graf        157  131  123.6   6.1%    70  
Maria Bueno         93   70   63.4   6.3%    70  
Garbine Muguruza    31   18   14.9  15.8%    70  
Mima Jausovec       32   18   15.0  15.9%    70  
Marion Bartoli      20   11    8.8  20.6%    70  
Sloane Stephens     24   12    9.7  20.8%    70

There are plenty of names here that we’d comfortably put alongside Williams and Seles as luminaries known for their clutch performances. Still, the difference between Osaka’s levels is on another planet.

Obligatory caveats

Again, of course, Osaka’s results could just be lucky. It doesn’t look that way when she plays, and the qualitative explanations add up, but … it’s possible.

Skeptics might also focus on the breakdown of the 52-player sample. In terms of second-week performance relative to forecasts, only one-third of the players were below average. That doesn’t seem quite right. The “average” woman outperformed expectations by about 30 Elo points.

There are two reasons for that. The first is that my sample is, by definition, made up of slam winners. Those players won at least four second-week matches, no matter how they fared in the rest of their careers. In other words, it’s a non-random sample. But that doesn’t have any relevance to Osaka’s case.

The second, more applicable, reason that more than half of the players look like outperformers is that any pre-match player rating is a measure of the past. Elo isn’t as much of a lagging indicator as, say, official tour rankings, but by its nature, it can only consider past results.

Any player who ascends to the top of the game will, at some point, need to exceed expectations. (If you don’t exceed expectations, you end up with a tennis “career” like mine.) To go from mid-pack to slam winner, you’ll have at least one major where you defy the forecasts, as Osaka did in New York in 2018. Osaka was an extreme case, because she hadn’t done much outside of the slams. If, for instance, Sabalenka were to win the US Open this year, she has done so well elsewhere that it wouldn’t be the same kind of shock, but it would still be a bit of a surprise.

In other words, almost every player to win a slam had at least one or two majors where they executed better than their previous results offered any reason to expect. That’s one reason why we find Sofia Kenin only two spots below Osaka on the list.

For Serena or Seles, the “rising star” effect doesn’t make much of a difference–those early tournaments are just a drop in the bucket of a long career. Yeah, it might mean they really only up their game by 110 Elo points instead of 130, but it doesn’t call their entire career’s worth of results into question. For Osaka or Kenin, the early results make up a big part of the sample, so this is something to consider.

It will be tougher to Osaka to outperform expectations as the expectations continue to rise. Much depends on whether she continues to struggle away from the big stages. If she continues to manage only one non-major title per year, she’ll keep her rating down and suppress those pre-match forecasts. (The predictions of major media pundits will be harder to keep under control.) Beating the forecasts isn’t necessarily something to aspire to–even though Serena does it, her usual level is so high that we barely notice. But if Osaka is going to alternate levels between world-class and merely very good, she could hardly do better than to bring out her best stuff when she does.

The Post-Covid Tennis World is Unpredictable. The Match Results Are Not.

Both the ATP and WTA patched together seasons in the second half of 2020, providing playing opportunities to competitors who had endured vastly different lockdowns–some who couldn’t practice for awhile, some who came down with Covid-19, and others who got knee surgery.

When the tours came back, we didn’t know quite what to expect. I’m sure some of the players didn’t know, either. Yet when we take the 2020 season (plus a couple weeks of 2021) as a whole, what happened on court was pretty much what happened before. The Australian Open, with its dozens of players in hard quarantine for two weeks, may change that. But for about five months, players faced all kinds of other unfamiliar challenges, and they responded by posting results that wouldn’t have looked out of place in January 2020.

The Brier end

My usual metric for “predictability” is Brier Score, which measures both accuracy (did our pre-match favorite win?) and confidence (if we think four players are all 75% favorites, did three of them win?). Pre-match odds are determined by my Elo ratings, which are far from the final word, but are more than sufficient for these purposes. My tour-wide Brier Scores are usually in the neighborhood of 0.21, several steps better than the 0.25 Brier that results from pure coin-flipping. A lower score indicates more accurate forecasts and/or better calibrated confidence levels.

Here are the tour-wide Brier Scores for the ATP and WTA since the late-summer restart:

  • ATP: 0.213 (2017 – early 2020: 0.212)
  • WTA: 0.192 (2017 – early 2020: 0.212)

The ATP’s level of predictability is so steady that it’s almost suspicious, while the WTA has somehow been more predictable since the restart.

But we aren’t quite comparing apples to apples. The post-restart WTA was sparser than the pre-Covid women’s tour, and the post-restart ATP was closer to its pre-pandemic normal.

Let’s look at a few things that do line up. Most of the top players showed up for the main events of the restarted tour, such as the US Open, Roland Garros, Rome, “Cincinnati” (played in New York), and men’s Masters event in Paris. Here are the 2019 and 2020 Brier Scores for each of those events:

Event          Men '19  Men '20  Women '19  Women '20  
Cincinnati       0.244    0.210      0.244      0.252  
US Open          0.210    0.167      0.178      0.186  
Roland Garros    0.163    0.199      0.191      0.226  
Rome             0.209    0.274      0.205      0.232  
Paris            0.226    0.199          -          -  
---
Total            0.204    0.202      0.198      0.218

(If you want even more numbers, I did similar calculations in August after Palermo, Lexington, and Prague.)

Three takeaways from this exercise:

  • Brier Scores are noisy. Any single tournament number can be heavily affected by a few major upsets.
  • Man, those ATP dudes were steady.
  • The WTA situation is more complicated than I thought.

Whether we look at the entire post-restart tour or solely the big events, the story on the ATP side is clear. Long layoffs, tournament bubbles, missing towelkids, Hawkeye Live … none of it had much effect on the status quo.

The predictability of the women’s tour is another thing entirely. The 12 top-level events between Palermo in July and Abu Dhabi in January were easier to forecast than a random sampling of a dozen tournaments from, say, 2018. But the four biggest events deviated from the script considerably more than they had in 2019 (or 2017 or 2018, for that matter).

From this, I offer a few tentative conclusions:

  • Big events, with their disproportionate number of star-versus-star matches, are a bit more predictable than other tournaments.
  • Accordingly, the post-restart WTA wasn’t as predictable as it first appeared. It was just lopsided in favor of tournaments that drew (most of) the top stars. Had the women’s tour featured a wider variety of events–which probably would’ve included a larger group of players, including some fringier ones–it’s post-restart Brier Score would’ve been higher. Perhaps even higher than the corresponding pre-Covid number.
  • Most tentative of all: The predictability of ATP and WTA match results might have itself been affected by the availability of tournaments. Top men were able to get into something like their usual groove, despite the weirdness of virus testing and empty stadiums. Most women never got a chance to play more than two or three weeks in a row.

Even six months after Palermo, the data is still limited. And by the time we have enough match results to do proper comparisons, some things will have gotten back to normal (hopefully!), complicating the analysis even further. That said, these findings are much clearer than my initial forays into post-restart Brier Scores in August. As for the Australian Open, quarantine and all, I’m forecasting a predictable tournament. At least for the men.