Can Learner Tien Hang With the Big Boys?

Learner Tien at the 2024 US Open. Credit: Hameltion

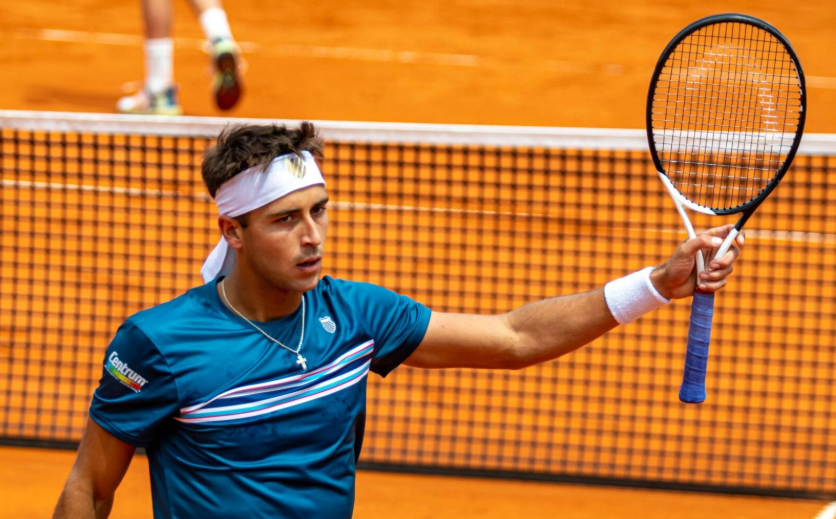
Learner Tien has done little in 2024 except win. He reeled off a 28-match streak from May to late July, collecting five titles, including his first at the Challenger level. He reached the quarter-finals at the tour event in Winston-Salem. After picking up two more Challenger crowns and another final, the young American opened his NextGen Finals campaign yesterday with a victory over top-50 player Jakub Mensik, 21st on the Elo list.

If you don’t follow prospects, you can be forgiven if you’ve only recently learned the name. Tien is only two weeks removed from his 19th birthday. He opened the year only barely inside the top 500. There were plenty of reasons to expect big things from the young man–a national 18s title at 16, two junior slam finals–but it would have been foolish to predict so much, so soon.

One reason to moderate expectations is simply age. For those not named Alcaraz or Sinner, it takes time to develop into a top player. Only one man under the age of 21–the cutoff for this week’s event in Jeddah–is ranked inside the top 40. Before Tien turned 19 this month, he was the top-ranked 18-year-old in the world, even with a triple-digit number next to his name.

The climb to the top is even more challenging for youngsters who can’t rely on pure power. Mensik, the highest-ranked teenager, is six feet, four inches tall, with weapons that make him seem bigger. Novak Djokovic recently called him “one of the best servers we have in the game.” The Czech has plenty to learn, and he will surely continue to refine his game. But to compete at the top level, he doesn’t have to.

Tien doesn’t have that luxury. He stands five inches shorter than Mensik. While he may have a bit more growth coming, five-eleven is near the bottom edge of what can be managed on the ATP tour. Only 15 members of the top 100 stand less than six feet, and even that list is skewed toward clay-court specialists. Sebastian Baez is the only five-foot-anything ranked above 45th.

The playing styles available to shorter athletes are limited, especially on hard courts. Tien has already demonstrated his mastery of many of those tactics. He can use his left-handedness to swing serve after serve wide, to a righty’s backhand. He is sturdy from the baseline, and you can take that literally: He’s unafraid of claiming territory right up to the line itself, taking advantage of both his quickness and raw speed. Fearless counterpunching has paid dividends for smaller stars from Olivier Rochus to Kei Nishikori to Alex de Minaur. As a lefty, the American has options those men didn’t.

Still, Tien’s transition from the Challenger tour to the big leagues could be rocky. Good defense and well-executed tactics are enough to clean up against top-200 competition. The combination was (just barely) sufficient against Mensik yesterday. But a full-time spot on the ATP tour requires more.

The game plan

For such a middling server, Tien wins a remarkable number of serve points. He ranks among the top quarter of Challenger tour regulars by serve points won, though his number is helped a bit by spending the entire year on hard courts. He does even better–64.6% compared to a tour norm below 62%–when aces and double faults are taken out of the equation. When the returner gets a racket on the ball, only ten players were better on hard courts.

It’s not surprising, then, that Tien excels on return. Among Challenger players with at least ten matches at the level in 2024, only two men–Dalibor Svrcina and his fellow American in Jeddah, Nishesh Basavareddy–topped Learner’s 42.5% clip. Tien is particularly effective converting second-serve return points.

He’s even better–or at least, he has been better this season–with more on the line. His rate of return points won rises to nearly 47% on break point chances, and he’s just as clutch on the other side of the ball. He saved 65.6% of the break points he faced, second at Challenger level to Mikhail Kukushkin. Here, he has already learned how to use the lefty serve, alternately forcing opponents far out wide and sticking them with uncomfortable body serves when he catches them leaning left for the slider.

The overall package is something between those of two other left-handers, Adrian Mannarino and Cam Norrie. Mannarino, also a sub-six-footer, throws the kitchen sink at opponents, keeping them off balance to compensate for his own lack of power. Norrie is considerably taller and has more firepower at his disposal. But he, too, refuses any rhythm to the man across the net. He alternates a loopy forehand with a flat backhand–except when he doesn’t, if you ever think you’ve found a groove.

Tien serves like Mannarino out of necessity. Even if he doesn’t get taller, the American will surely get stronger, so his 90-mile-per-hour first serves from this year’s US Open probably won’t tell the story of his entire career. But at the moment, he relies on angles and variety. Mannarino has overcome his limitations to the tune of a top-20 peak ranking. On the other hand, his playing style (and the comically loose string tension it relies on) is so unique he hardly provides an example to follow.

In the Las Vegas Challenger final back in September, Tien looked particularly like Norrie. Fighting the wind, he spun forehands and zinged backhands, a combination that made it impossible for the bigger-hitting Tristan Boyer to get comfortable. In other settings, though, the youngster is increasingly using his forehand as a (flatter) weapon, building points one sharp angle at a time.

The most instructive element of these comparisons, though, is the way in which the American differs from his fellow lefties. Mannarino reached Tien’s current ranking when he was 21, after more than 250 pro matches. Norrie–who ultimately peaked inside the top ten–played three years of college tennis and didn’t approach the top 100 in the world until he was 22. Tien, by contrast, is clearing all these hurdles on the first try. Deploying a brainy playing style that normally takes years to refine, the American is making it look natural.

The projection

Aside from size and serve speed, Tien’s future looks bright. The 19-year-old has won 61 of 73 matches across all levels this year. Within a few months, he is likely to crack the top 100. At Challenger level, his serve hasn’t held him back: As we’ve seen, he wins more service points than most of his peers, despite gaining fewer free points with the serve itself.

The question, then, is what effect Tien’s attributes have on career trajectory. Everyone wins fewer points at tour level than at Challengers–the competition is better, so it would be weird if it were otherwise. But the ratio isn’t uniform. Mannarino has won about 7% fewer serve points at tour level than he did in hard-court Challenger matches, while Marcos Giron (another sub-six-footer) lost less than 1% in the transition.

These Challenger-to-tour conversions offer some insight into Learner’s future. Since he has played almost all of his pro matches on hard courts, we’re going to calculate something a bit quirky. How do serve and return win rates change from hard-court Challenger matches to all tour-level matches? That’s what we want to know for the 19-year-old: He’ll need to play on all surfaces soon, probably starting in 2025. This transition he’s about to make–how did it go for other players?

The first-pass answer is that pros are able to retain something like their hard-court Challenger serve win percentage, seeing that number drop by 2%. But they lose a lot against tougher competition on return, winning 7.1% fewer return points. The following table shows those numbers (“Conv%”), along with Tien’s career record at hard-court Challengers (“Tien CH”), along with what the conversion factors suggest for his tour-level win rates (“Tien Adj”):

        Conv%  Tien CH  Tien Adj  
Serve   98.0%    63.3%     62.0%  
Return  92.9%    42.3%     39.3%

Those are awfully respectable numbers. 62% serve points is marginal for a tour regular, but combined with 39.3% return points, it’s enough. The combination is about what Francisco Cerundolo managed this year, and he’s ranked 30th in the world.

A word of caution: This type of conversion is not suggesting that Tien’s level is the same as Cerundolo’s now. The calculation involves taking each active player’s career records in tour and Challenger main-draw matches. That probably underestimates Tien’s potential, because most men play the majority of their Challenger matches after their 19th birthday. But a player’s career numbers will include their peak, which typically comes much later. At the very least, these numbers suggest Tien could reach Cerundolo’s level (or better) eventually.

The (other) adjustments

That’s just a first-pass number, because we haven’t gotten to height and handedness. Taking those into account does not help Learner’s case.

Lefties, it turns out, have a rougher transition than right-handers do. Here are the serve and return conversion factors, separated by hand:

        Lefties  Righties  
Serve     97.3%     98.1%  
Return    92.1%     93.0%

Not a huge difference, but hey, the margins in tennis are small. I suspect it is slightly harder for left-handers to move up a level for two reasons. First, the less experienced the opponent, the more valuable it is to be unusual, and lefties are certainly that, making up barely one-tenth of the player pool. At tour level, the novelty is gone: ATP regulars generally know how to handle left-handers.

Second, lefties are more likely to get by with what we might call “crafty” tennis, rather than power. (That’s related to the first reason: They’ve reached Challenger level because they’ve outsmarted inexperienced opponents thus far.) Craftiness might be enough against #180 in the world, but against, say, the Hurkacz serve, all craftiness gets you is a few more tuts of approval in the press box.

Whatever the reason, Tien’s left-handedness means we need to update our tour-level forecast:

    (L) Conv%  Tien CH  Tien Adj  
Serve   97.3%    63.3%     61.6%  
Return  92.1%    42.3%     39.0%

Not a huge hit, but ~0.4% of total points won is roughly equivalent to four places in the rankings. A small number here ultimately translates to much bigger ones when denominated by tour-level prize money.

And then, size. Here are the conversion factors for players in three height categories: under six feet, from six feet to six-foot-three, and above six-foot-three:

        under 6'0  6'0 to 6'3  over 6'3  
Serve       97.0%       97.9%     99.0%  
Return      92.0%       93.4%     92.6%

Again, craftiness doesn’t convert. Players under six feet tall lose the most points between hard-court Challengers and tour level. The tallest players remain almost as effective on serve, while the middle category retains the most of their return effectiveness.

Here’s the Tien update, using the sub-six-feet conversion rates:

        (< 6') Conv%  Tien CH  Tien Adj  
Serve          97.0%    63.3%     61.4%  
Return         92.0%    42.3%     38.9%

Not much of a difference from the left-handed numbers, though we keep going down. This is increasingly the profile of a clay-court specialist, and we might be outside the top 40 now.

Of course, Learner is both left-handed and (relatively) small. My mini-study of active players doesn't give us a big enough pool of data to extrapolate from the small group of small lefties. Instead, a back-of-the-envelope combination of the two factors gives us conversion factors of 96.3% for serve and 91.3% for return:

        (L&Sm) Conv%  Tien CH  Tien Adj  
Serve          96.3%    63.3%     61.0%  
Return         91.3%    42.3%     38.6%

For the first time, the adjusted versions of Tien's Challenger-level stats are underwater, summing to less than 100%. Winning 61% of service points would rate fourth-worst in the current ATP top 50, just ahead of Sebastian Baez. 38.6% on return is respectable, though not enough to consistently challenge for titles when combined with such a mediocre serve.

The exact numbers are not important: For one thing, we don't have enough recent data to know exactly how size and handedness interact. Maybe it's not quite that bad. Suffice it to say that both lefties and undersized players are more likely to struggle in the transition from Challengers to the full tour. A player who fits both categories should not expect a smooth trip up the ladder.

For Tien to beat these projections, all he has to do is improve more than the average pro does. As noted above, he already has something of an edge: He posted most of his excellent Challenger numbers as an 18-year-old. That's Alcaraz territory. At the same age, Mannarino was struggling at Futures level, and future top-tenner Norrie was headed off to college. If for some reason Tien plays a lot of Challenger matches in 2025, his stats will probably look better, and the tour-level predictions would change as well.

As Learner and his team are undoubtedly aware, those improvements need to center on the serve. The youngster probably already has what it takes to break serve once or twice a set on tour. But without a bigger first-strike weapon, he'll struggle to get those opportunities. Yesterday he withstood Jakub Mensik's event-record 24 aces, winning in a fifth-set tiebreak despite losing 14 more total points than Mensik did. The American played brilliant tennis, yet it took luck and brilliant timing to pull out the victory. For a five-foot-eleven left-hander among the giants of the professional game, it's not the last tightrope he'll have to walk.

* *

Subscribe to the blog to receive each new post by email:
 

Identifying Underrated Players With Minor League Elo

I’ve just revised my published Elo ratings (men, women) to better reflect the performance of players who mostly compete at the (men’s) ATP Challenger and (women’s) ITF levels. Previously, my Elo ratings used only tour-level main-draw matches. For top players, it makes very little difference–not only do Novak Djokovic and Simona Halep play no matches at the lower levels, they rarely encounter opponents who spend much time there. But for the second tier of players, the effect can be substantial.

The Elo system rates players according to the quality of their opponents. Beat a good player with a high rating, and your own rating will jump by a healthy margin. Beat a weakling, and your rating will inch up a tiny bit. Essentially, Elo looks at each result and asks, “Based on this new result, how much do we need to adjust our earlier rating?” When Bianca Andreescu upset Caroline Wozniacki in Auckland last week, the system responded by upping Andreescu’s rating by quite a bit, and by penalizing Wozniacki more than for the typical loss. After a more predictable result, like Djokovic’s defeat of Damir Dzumhur, ratings barely move.

It’s important to understand the basic mechanics of the system, but the main takeaway for most fans is that Elo just works. The algorithm generates more accurate player ratings (and resulting match forecasts) than the official ATP and WTA rankings, among other attempts to rank players. Now, you can see Elo rankings for a much wider range of players.

Of of my main uses of Elo ratings is identifying players whose official rankings haven’t caught up to reality. For instance, a few months ago I noted when Daniil Medvedev moved into the Elo top ten, even though he has yet to crack that threshold on the official list. Most players who reach the top ten on the Elo table eventually do the same in the ATP or WTA rankings. Another two current examples are Aryna Sabalenka and Ashleigh Barty, considered by Elo to be two of the top three women on tour right now, even though neither is in the top ten of the WTA rankings. That may be too aggressive, and the margins at the top of the women’s list are tiny right now, but it is a clear signal that these women’s results bear watching. (We talked about this on the most recent Tennis Abstract podcast.)

Now that we have unified Elo lists that cover more players, let’s dig deeper. For each tour, let’s find the players current outside the official top 100s who are rated the highest by the more sophisticated formula. First, the ATP:

Player                  ATP Rank  Elo Rank  
David Ferrer                 124        36  
Thanasi Kokkinakis           145        62  
Miomir Kecmanovic            126        66  
Jack Sock                    105        77  
Reilly Opelka                102        84  
Ricardas Berankis            107        86  
Marcos Baghdatis             122        87  
Gilles Muller                137        88  
Daniel Evans                 190        89  
Viktor Troicki               201        90  
Horacio Zeballos             182        92  
Jared Donaldson              115        94  
Mikael Ymer                  196        95  
Egor Gerasimov               157       100  
Lloyd Harris                 119       102  
Tommy Paul                   195       104  
Guillermo Garcia Lopez       101       106  
Felix Auger Aliassime        106       108  
Alexei Popyrin               149       109  
Dudi Sela                    240       114

One thing that pops out from the list is the number of veterans. Elo ratings are “stickier” than ATP rankings, since the official system works with only 52 weeks worth of results. Elo ratings make constant adjustments, but quality performances–even when they are more than 52 weeks old–continue to affect current ratings for some time. David Ferrer has had a hard time staying healthy enough to compete at his former level, but according to Elo, he remains fairly dangerous when he is able to take the court.

Fortunately the list isn’t all veterans. Elo suggests that younger players such as Thanasi Kokkinakis, Miomir Kecmanovic, Mikael Ymer, and Tommy Paul are better than their current rankings indicate.

The WTA list is even more laden with veterans, players who are still competing at a high level, if not as frequently as they used to:

Player                WTA Rank  Elo Rank  
Lucie Safarova             105        39  
Coco Vandeweghe            100        40  
Shuai Peng                 129        43  
Svetlana Kuznetsova        106        50  
Sara Errani                114        52  
Varvara Lepchenko          134        80  
Laura Siegemund            110        84  
Kristyna Pliskova          101        96  
Anna Kalinskaya            167        97  
Viktorija Golubic          104        98  
Ivana Jorovic              117        99  
Marie Bouzkova             120       103  
Kateryna Bondarenko        140       104  
Sachia Vickery             123       105  
Veronika Kudermetova       111       107  
Sabine Lisicki             198       109  
Vitalia Diatchenko         131       112  
Yanina Wickmayer           126       113  
Nao Hibino                 115       114  
Danielle Lao               169       115

Part of the reason why so few prospects appear on this list is because of my decision to exclude ITF $25Ks. For example, up-and-coming 18-year-old Kaja Juvan, who knocked out Yanina Wickmayer in Australian Open qualifying today, hasn’t played nearly enough matches at higher levels to appear on my Elo list. But last year, she was 29-7 at ITF $25Ks, and won her last ten matches at that level.

Another issue is that the most promising women tend to climb into the top 100 more quickly. Another 18-year-old, Dayana Yastremska, rocketed up the rankings with a tour-level title in Hong Kong last fall. She sits at No. 59 on the WTA table, but after 13 top-100 wins in 2018, Elo is even more optimistic, placing her at No. 27, just ahead of Maria Sharapova and Venus Williams.

I’ll continue to update these expanded Elo ratings weekly and use them to generate forecasts for every tour-level and Challenger event. Enjoy!

Translating ATP Statistics Across Main Tour and Challenger Levels

Italian translation at settesei.it

What is the gap between the top-level ATP Tour and the lower-level ATP Challenger Tour? Some players pile up trophies in the minor leagues yet have a hard time converting that success to match wins on the big tour, while others struggle with the week-to-week grind of the challengers but excel when given opportunities on the larger stage.

Let’s take a look at a method that measures the difference between the skill level on the two tours. Once we can translate stats between levels, we can identify those players who are much better or worse than expected when they have the chance to compete against the best.

The algorithm I’ll use is almost identical to the one baseball analysts have used for decades to determine league equivalencies. For instance, we might find that a batting average of .300 in Triple-A (the highest minor league) is equivalent to .280 in the majors, meaning that, if a player is batting .300 in Triple-A, we’ll expect him to bat .280 in the majors. In tennis terms, it may be that a 10% ace rate in challengers is equivalent to a 8% ace rate on the main tour. Not every player will exhibit that precise drop in performance–some may even appear to get a little better–but on average, a league equivalency tells us what to expect when a player changes levels.

Here is the algorithm for league equivalencies, as applied to men’s tennis:

  1. Pick a stat to focus on. I’ll use Total Points Won (TPW) here.
  2. Neutralize that stat as much as possible. In baseball, that means controlling for the difference in parks; in tennis, it means controlling for competition. For the following, I’ve adjusted for each player’s quality of competition using a method I described about a year ago. Most players’ numbers are about the same after the adjustment, but a particularly easy or tough schedule means a bigger shift. For instance, Denis Shapovalov posted a TPW of 49.8% on the big tour last season, but because he played such high-quality competition, the adjustment bumps him up to 52.1%, 18th among tour regulars.
  3. Identify players who competed at both levels, and find their adjusted stats at each level. Shapovalov played 18 tour-level matches and 30 challenger-level matches last year, with adjusted TPW numbers of 52.1% and 54.4%, respectively.
  4. Calculate the ratio for each player. For Shapovalov last year, it was 1.044 (54.4 / 52.1).
  5. Finally, take a weighted average of every player’s ratio. The weight is determined by the minimum number of matches played at either level, so for Shapovalov, it’s 18. Using the minimum means that a player like Gleb Sakharov (1 ATP match, 37 challenger matches) can be included in the calculation, but has very little effect on the end result.

Here are the results for the last six full seasons. Each ratio is the relationship between challenger-level TPW and tour-level TPW:

Year  Ratio  
2017  1.086  
2016  1.086  
2015  1.098  
2014  1.103  
2013  1.100  
2012  1.100

The average of these yearly equivalency factors is roughly the difference between a 52.5% TPW at challengers and a 48.0% TPW on the main tour. The shift from 2012-15 to 2016-17 may reflect the injuries that have sidelined the elites. With fewer elite players on court, the gap between the two tours narrows.

Now that we know the difference between the levels, we can find the players who defy the usual patterns. Of the 100 players with the most “paired” matches–that is, with the most matches at both levels in the same years–here are the 20 with the lowest ratios. Low ratios mean less difference in performance between the two levels, so these guys are either overperforming at tour level or underperforming at challengers:

Player              ATP M  CH M  Min M  Ratio  
Matthew Ebden          62   140     39  0.982  
Jared Donaldson        68    78     37  1.030  
Jack Sock              81    45     38  1.039  
James Duckworth        53   156     53  1.042  
Andrey Rublev          56    79     42  1.047  
Vasek Pospisil         96    76     60  1.047  
Thiemo De Bakker       48    87     44  1.048  
Samuel Groth           84   133     58  1.049  
Michael Berrer         59   107     56  1.050  
Ruben Bemelmans        41   178     41  1.052  
Dustin Brown          120   173    111  1.055  
Benoit Paire          295    53     53  1.059  
Peter Gojowczyk        46   132     44  1.059  
Michael Russell        58    78     58  1.061  
Marius Copil           58   180     58  1.063  
Taylor Harry Fritz     59    44     41  1.065  
Jordan Thompson        38    88     38  1.066  
Illya Marchenko        56   116     37  1.066  
Tatsuma Ito            65   179     65  1.066  
Ryan Harrison         124    84     59  1.068

The middle columns show the total number of ATP matches, challenger matches, and “paired” matches between 2012 and 2017 (“Min M”) for each player. (The last number gives an indication of just how much data was available for the single-player calculation.) Aside from a few big-serving North Americans near the top of this list, I don’t see a lot of obvious commonalities. There are some youngsters, some veterans, more big servers than not, but nothing obvious.

(Shapovalov doesn’t have enough paired matches to qualify, but his overall ratio is 1.035, good for third on this list.)

Here is the opposite list, the quintile of 20 players who have overperformed at challengers or underperformed on tour:

Player               ATP M  CH M  Min M  Ratio  
Florian Mayer          152    45     45  1.180  
Mikhail Youzhny         91    38     38  1.169  
Aljaz Bedene           144   121     80  1.160  
Filippo Volandri        62   101     62  1.158  
Robin Haase            194    71     71  1.157  
Tobias Kamke           102   144     73  1.155  
Adrian Mannarino       234   115     86  1.155  
Filip Krajinovic        36   167     36  1.148  
Albert Ramos           111    67     62  1.144  
Paul Henri Mathieu     147    96     82  1.141  
Kenny De Schepper       77   196     77  1.140  
Facundo Bagnis          45   197     45  1.136  
Pablo Cuevas           127    52     43  1.136  
Ivan Dodig              76    48     41  1.135  
Santiago Giraldo       146    70     56  1.135  
Paolo Lorenzi          204   191    124  1.135  
Thomaz Bellucci        162    44     44  1.134  
Albert Montanes        113   109     70  1.130  
Rogerio Dutra Silva     57   210     57  1.130  
Lukas Lacko            122   181    108  1.129

There are more clay-courters here than on the first list, and the very top of the ranking includes veterans who have mastered the challenger level, even if they still struggle to maintain a foothold on the main tour. I’ve had to exclude one player who belongs on this list: Gilles Muller broke my algorithm with his 45-9 challenger season in 2014. When I took him out of the 2014 calculations, the overall numbers changed very little, but it means no Muller here. Whatever his exact ratio, I can say that his tour-level performance hasn’t matched that 2014 run at challengers.

The bottoms of the two lists indicate that there isn’t that much variation between players. The middle 60% of players all have ratios between about 1.07 and 1.13, while the yearly averages hover around 1.09 and 1.10. Some players under consideration here have fewer than 50 “paired” matches over the six seasons, so a difference of a couple hundredths is far too little to draw any conclusions.

This algorithm, beyond suggesting what to expect from players when they move up from challengers to the main tour, could apply the same reasoning to other pairs of levels, such as ITF Futures and challengers, or women’s ITFs and the WTA tour. It could even compare narrower levels, such as ITF $10,000 events with ITF $15,000s, or ATP 250s with ATP 500s. The method is a staple of analytics in other sports, and it has a place in tennis, as well.

Benoit Paire and Overqualified Challenger Contenders

Italian translation at settesei.it

With three ATP tour-level events on the slate this week, Benoit Paire considered his options and elected to play none of them. Instead, the world #23 is the top seed at the Brest Challenger, making him the highest ranked player to enter a challenger this year–by a wide margin.

Top-50 players may only enter challengers if they are given a wild card, and top-ten players may not enter them at all. Still, since 1990, a top-50 player has played a challenger just over 500 times, at a rate of about 20 per year. (Some of these players didn’t need a wild card, as entry is determined by ranking several weeks before the tournament, during which time rankings rise and fall.)

Many of the high-ranked wild cards fall into one of two categories: Players who lose early in Slams, Indian Wells, or Miami; and clay-court specialists seeking more matches on dirt. Paire’s decision this week–like the Frenchman himself–doesn’t follow one of these common patterns.

Anyway, here are the top-ranked players to contest challengers since 1990, along with their results. A result of “W” means that the player won the title, while any other result indicates the round in which the player lost.

Year  Event           Player               Rank  Result  
2003  Braunschweig    Rainer Schuettler    8     R16     
1991  Johannesburg    Petr Korda           9     SF      
1994  Barcelona       Alberto Berasategui  10    W       
1994  Graz            Alberto Berasategui  11    R16     
2008  Sunrise         Fernando Gonzalez    12    QF      
2004  Luxembourg      Joachim Johansson    12    W       
2011  Prostejov       Mikhail Youzhny      13    QF      
2008  Prostejov       Tomas Berdych        13    QF      
2003  Prague          Sjeng Schalken       13    W       
2005  Zagreb          Ivan Ljubicic        14    W       
2004  Bratislava      Dominik Hrbaty       14    F       
2004  Prostejov       Jiri Novak           14    QF      
2003  Prostejov       Jiri Novak           14    R32     
2007  Dnepropetrovsk  Guillermo Canas      15    SF      
2002  Prostejov       Jiri Novak           15    F       
1998  Segovia         Alberto Berasategui  15    QF      
1997  Braunschweig    Felix Mantilla       15    F       
1997  Zagreb          Alberto Berasategui  15    W

(Schuettler and Korda were outside the top ten a couple of weeks before their respective challengers.)

A look at this list suggests that Alberto Berasategui entered challengers as a top-fifty player more than anyone else. He’s close–with 12 such entries, he’s tied for second with Jordi Arrese. The player who dropped down a level the most times is Dominik Hrbaty, who played 17 challengers while ranked in the top 50. (The active leaders are Jarkko Nieminen with ten and Andreas Seppi with nine.)

Despite all those attempts, Hrbaty wasn’t particularly successful as a high-ranked challenger player. He won only 2 of those 17 events, reaching only one other final. Top-50 players aren’t guaranteed to win these titles, of course, but in general, they have outperformed Hrbaty, winning 18% of possible titles. Here are top-50 players’ results broken down by round:

Result       Frequency  
Title            18.1%  
Loss in F         9.3%  
Loss in SF       11.3%  
Loss in QF       17.1%  
Loss in R16      22.0%  
Loss in R32      22.2%

Paire is a better player than this sample’s average ranking of 37. Combined with a favorable surface, he gets a much more optimistic forecast from my algorithm, with a slightly better than one-in-three chance of winning the title. With a futures title, an ATP trophy, and a pair of challenger triumphs already in the books this year, it seems fitting that Benoit would add another oddity to his wide-ranging season.

Continue reading Benoit Paire and Overqualified Challenger Contenders

Westerhof, Van Der Duim, and a Strong Whiff of Match Fixing

This afternoon at the ATP Meerbusch Challenger in Germany, all eyes were definitely not on a first-round match between Dutchmen Boy Westerhof and Antal Van Der Duim. Both are ranked outside the top 250, neither has ever cracked the top 200, and both are in their late twenties.

It appears that the two players assumed no one would be watching. Before the match, the markets on Betfair were very suspicious:

For those of you not accustomed to parsing betting markets, here’s a summary of what the market thought was going to happen:

  • Van Der Duim’s chances of winning the match were between 75% and 80%.
  • Van Der Duim’s odds of winning the first set were roughly 35%.
  • There was a better than 50/50 chance that Van Der Duim would win the match in three sets. The odds of any other specific outcome (e.g. Westerhof wins in three) were minuscule in comparison.

The match odds in themselves might have raised a few eyebrows, but could be written off as owing to Westerhof’s recent run of poor play, or perhaps some information gathered on site about a nagging injury. When combined with the other markets, however, it’s clear that something very fishy was going on.

The match went precisely according to script. After Westerhof took the first set, 6-4, the market got more and more confident about Van Der Duim winning the second set:

Van Der Duim remained the favorite even after going down an early break in the second set. Shortly thereafter, with no cameras watching, Westerhof seems to have decided not to waste any more time:

https://twitter.com/baselinebetting/status/498823405282807809

In the end, Van Der Duim beat Westerhof, 4-6 6-3 6-3. No one following the betting markets was at all surprised.

Nor should we be shocked that this sort of thing happens. With the middling prize money on offer at Challenger events–Westerhof will get about $500, and if Van Der Duim loses in the next round, he’ll be awarded about $800–there’s more money to be made by losing matches than winning them.

While we don’t know how often matches are fixed, something was very wrong about this one. Because the markets so blatantly telegraphed the fix, it poses an important question to the sport’s governing bodies. If they don’t take this opportunity to act, it will send a very clear message to Challenger-level players that match-fixing is acceptable practice.

(Thanks to the three Twitter users quoted above, who brought this match to my attention.)

Nick Kyrgios and the First Fifty Matches

Italian translation at settesei.it

When Nick Kyrgios lost the Wimbledon quarterfinal to Milos Raonic yesterday, he was playing his 50th career match at the Challenger level or above. Round numbers invite big-picture analysis, so let’s see how Kyrgios stacks up to the competition at this early milestone.

When Monday’s rankings are released, Nick will debut in the top 100, all way up to #66. Only Rafael Nadal (61), Gael Monfils (65), and Lleyton Hewitt (65) have been ranked higher at the time of their 51th Challenger-or-higher match.  Roger Federer was #93, Novak Djokovic was #128, and Jo Wilfried Tsonga was #314. Of the current top 100, only ten players reached a double-digit ranking by their 51st match.

The wealth of ranking points available at Grand Slams have played a big part in Kyrgios’s rise, but they don’t tell the whole story. He has won 36 of his first 50 matches, equal to the best of today’s top 100. Nadal went 36-14, and next on the list is Djokovic and Santiago Giraldo (who played almost all Challengers) at 34-16. Most of Nick’s wins before this week came at Challengers, and he has won four titles at the level.

No other active player won four Challenger titles in his first 50 matches. Eight others, including Djokovic, Tsonga, Stanislas Wawrinka, and David Ferrer, won three. All of them needed more events at the level to win three titles than Kyrgios did to win four.

Nick’s short Challenger career is another indicator of a bright future. He has only played nine Challenger events, and with his ranking in the 60s, he may never have to play one again. As I’ve previously written, the best players tend to race through this level: Federer, Nadal, and Djokovic all played between eight and twelve Challengers. It’s a rare prospect that makes the jump in fewer than 20 events, and when I researched that post two years ago, more than half of the top 100 had played at least 50 Challengers.

One category in which the Australian doesn’t particularly stand out is age. When he plays his 51st match, he’ll a couple of months past his 19th birthday. Roughly one-quarter of the current top 100 reached that match total at an earlier age. Nadal, Richard Gasquet, and Juan Martin del Potro did so before their 18th birthday, while Djokovic, Hewitt, and Bernard Tomic needed only a few more weeks beyond that.

Without knowing how Kyrgios would’ve performed on tour a year or two earlier, it’s tough to draw any conclusions. His 36-14 record at 19 certainly isn’t as impressive as Rafa’s equivalent record at 17.

Cracking the top 100 at 17 or 18 is a much better predictor of future greatness than doing so at 19, but as the tour ages, 19 may be the new 16. Grigor Dimitrov didn’t enter the top 100 until he was three months short of his 20th birthday, while Dominic Thiem and Jiri Vesely were still outside the top 100 on their 20th birthdays. Among his immediate cohort, Kyrgios stands alone: No other teenager is ranked within the top 240.

As predictive measures go, Nick’s Wimbledon performance–built on his poise under pressure–is the best sign of them all. Only seven active players have reached a Grand Slam quarterfinal as a teenager, and four of them–Fed, Rafa, Novak, and Lleyton–went on to reach #1. (The other three are Delpo, Tomic, and Ernests Gulbis.)

For a player with only fifty matches under his belt, that’s excellent company.

Challenger Tour Finals Forecast

I wrote an extensive preview of this week’s Challenger Tour Finals for The Changeover, so you should check that out first.  (Also worth a read is the preview at Foot Soldiers of Tennis.)

Because so much less separates players at this level (compared to those at last year’s World Tour Finals), my forecast stops just short of throwing its hands up in dismay.  Coming into the event, Italian clay specialist Filippo Volandri was the favorite, with a 15.5% chance of winning the event.  He lost today to Alejandro Gonzalez, making it much less likely that he’ll progress out of the round-robin stage.

Today’s other winners were top seed Teymuraz Gabashvili, Oleksandr Nedovyesov, and Jesse Huta Galung.  My numbers now consider Huta Galung the favorite, with a better than 20% chance of winning the title.  The situation in Grupo Verde will become much more clear after tomorrow’s night match between Gabashvili and Nedovyesov.

Here is the pre-tournament forecast:

Player       3-0  2-1  1-2  0-3     SF      F      W  
Gabashvili   12%  38%  37%  13%  49.8%  24.3%  12.0%  
Volandri     15%  40%  35%  10%  55.3%  29.3%  15.5%  
Nedovyesov   14%  39%  36%  11%  53.0%  26.9%  13.7%  
Huta Galung  14%  39%  36%  11%  53.8%  28.2%  14.6%  
Gonzalez     10%  35%  40%  15%  45.0%  21.8%  10.4%  
Ungur        10%  35%  40%  15%  45.0%  20.9%   9.8%  
Martin       11%  36%  39%  14%  46.0%  22.4%  10.7%  
Clezar       13%  38%  37%  11%  52.2%  26.3%  13.3%

And here is the forecast updated with the results of today’s four matches:

Player       3-0  2-1  1-2  0-3     SF      F      W  
Gabashvili   24%  50%  26%   0%  71.5%  35.0%  17.1%  
Volandri      0%  27%  50%  23%  30.2%  16.2%   8.6%  
Nedovyesov   28%  50%  22%   0%  75.7%  38.3%  19.5%  
Huta Galung  27%  50%  23%   0%  74.7%  39.0%  20.5%  
Gonzalez     23%  50%  27%   0%  70.1%  33.7%  15.8%  
Ungur         0%  22%  50%  29%  23.1%  10.8%   5.1%  
Martin        0%  23%  50%  27%  25.1%  12.2%   5.9%  
Clezar        0%  27%  50%  23%  29.6%  14.9%   7.4%

(My algorithm doesn’t implement the details of the number-of-sets-won tiebreaker, so Guilherme Clezar, the only loser today to win a set, probably has a slightly better chance of advancing than these numbers give him credit for.)

Challenger charting: The most interesting match of the day–if not the cleanest–was the last one, between Nedovyesov and Clezar.  I charted it, so you can check out detailed serve, return, and shot-by-shot stats for that contest.

And if you’re really into this stuff–Challengers and/or charting–here are my stat reports from yesterday’s first-round matches in Champaign between Ram and Giron and Sandgren and Peliwo.

Yen Hsun Lu’s Challenger Choices

Yen Hsun Lu has played in a lot of tournaments with fields that look like this month’s Leon and Guadalajara Challengers.  Ranked in the bottom half of the top 100, he is often the only top-100 player in the draw.  In fact, he has been the top seed in every Challenger he’s played for more than a year.

Top seeded or not, Lu seems to really like Challengers.  When other players at his level are contesting ATP 250s or Masters-level qualifying draws, the Taiwanese #1 is demonstrating his dominance of the minor leagues.  And it’s working: In large part thanks to titles in places such as Shanghai, Ningbo, Seoul, and Singapore, he has kept his ranking in the top 100 for about three years.

Lu’s combination of consistency near the top and Challenger preference is unusual but not unique.  He is one of 14 players who, since 2007, have played at least 20 Challenger events while ranked inside the top 100.  He is, however, the most extreme member of the group. This week’s Guadalajara event will be his 40th Challenger as a member of the top 100.  Dudi Sela, also in Guadalajara but currently outside the top 100, has played 31 while part of that more elite club.

Almost every week of the season, there is some tour-level event, and usually, anyone in the top 100 would make the cut for qualifying, if not necessarily the main draw.  But for Lu, the ATP option isn’t always so inviting.  He hates clay, with only two career wins on the surface, one of which was twelve years ago in a Davis Cup Group 2 tie against Pakistan.  (No, not against Qureshi. He lost to Qureshi.)  Despite five entries and a valiant effort in a fifth-set, 11-9 defeat against Jeremy Chardy last year, he has never won a match at Roland Garros.

His Challenger preferences are even more extreme: Out of 137 career events at this level, only two have come on clay.  He is the Alessio Di Mauro of hard courts.

While Sela has a longer track record (and a bit more success) on dirt, his current preferences are very similar.  Given the choice between a hard-court Challenger and anything on clay, and he’ll take the Challenger.  While there aren’t as many tour-level events on clay as Rafael Nadal might like, there are enough to keep Lu and Sela on the lower circuit for several months of the year.

Most of the other players who rack up extensive Challenger records while ranked in the top 100 have the opposite preference.  Filippo Volandri and Ruben Ramirez Hidalgo are the most extreme.  While ranked that high, each has only played three ATP qualifying events, despite entering 29 and 27 Challenger events, respectively, since 2007.  (RRH’s career figures are higher; I’m using the time span since 2007 because my qualifying database only goes back that far.)

Here’s the list of all players who have contested 20 or more Challengers while ranked in the top 100 since 2007, along with the number of ATP qualifying draws they entered while in the top 100 and the rate at which they chose Challengers out of these two options.

Player                 CHs  Qs  CH+Qs  CH/CH+Q  
Yen Hsun Lu             38  10     48      79%  
Dudi Sela               30   6     36      83%  
Filippo Volandri        29   3     32      91%  
Carlos Berlocq          29   5     34      85%  
Michael Russell         28  25     53      53%  
Ruben Ramirez Hidalgo   27   3     30      90%  
Frederico Gil           26  12     38      68%  
Daniel Gimeno Traver    26  21     47      55%  
Nicolas Mahut           22   7     29      76%  
Oscar Hernandez         22   8     30      73%  
Pere Riba               22  11     33      67%  
Tobias Kamke            22  18     40      55%  
Diego Junqueira         21   2     23      91%  
Olivier Rochus          21  11     32      66%

National Showdowns in Challenger Finals

If Dudi Sela and Amir Weintraub both win their semifinal matches at the Leon Challenger today–against Donald Young and Jimmy Wang, respectively–it would the first time that two Israelis face off in a Challenger final, at least since the beginning of 1991, when my challenger database begins.

In over 2800 Challengers in that time span, 407 of them have ended with finals contested between countrymen.  As you might guess, all-USA finals have been the most common, at 84, partly due to the former dominance of Americans in the sport and also owing to the large number of Challengers held on US soil.  Next in line are Argentina (59) and Spain (52), two countries with the key combination of many events and a large pool of second-tier pros.

Perhaps more interesting are the countries at the bottom of list.  Nations like Slovenia*, Taiwan, and Slovakia have more in common with Israel–few events in-country, with just a handful of players contesting Challengers.  Those are the three most recent countries to join the list.  Given the contemporary Challenger field, even more surprising are inclusions such as Norway, Denmark, Mexico, and Morocco, all of which enjoyed all-national Challenger finals in the 90s.

*Slovenia is increasingly becoming a force to be reckoned with.  Led by the underrated Grega Zemlja, it is one of only 12 countries with three players in the ATP top 100.

Given that 29 countries have experienced such a final, we might expect some nations that aren’t on the list.  A few that come to mind are Switzerland (usually better represented than the current two players ranked between 20 and 300), Ukraine (currently six players between #98 and #300), and Portugal (surely Rui Machado and Frederico Gil will meet in a final eventually).

Here’s the full list, including the most recent final for each country:

Country  CH Fs  Date      Event            Winner              Runner-up                
USA      84     20130204  Dallas CH        Rhyne Williams      Robby Ginepri            
ARG      59     20120730  Manta CH         Guido Pella         Maximiliano Estevez      
ESP      52     20121112  Marbella CH      Albert Montanes     Daniel Munoz De La Nava  
GER      39     20130121  Heilbronn CH     Michael Berrer      Jan Lennard Struff       
FRA      36     20121001  Mons CH          Kenny De Schepper   Michael Llodra           
ITA      31     20110718  Orbetello CH     Filippo Volandri    Matteo Viola             
CZE      24     20120312  Sarajevo CH      Jan Hernych         Jan Mertl                
BRA      20     20120910  Cali CH          Joao Souza          Thiago Alves             
AUS      17     20130225  Sydney1 CH       Nick Kyrgios        Matt Reid                
NED      5      20100906  Alphen CH        Jesse Huta Galung   Thomas Schoorel          
BEL      4      20120924  Orleans CH       David Goffin        Ruben Bemelmans          
ROU      4      20120806  Sibiu CH         Adrian Ungur        Victor Hanescu           
AUT      4      20070716  Rimini CH        Oliver Marach       Daniel Koellerer         
COL      3      20120709  Bogota CH        Alejandro Falla     Santiago Giraldo         
JPN      3      20120423  Kaohsiung CH     Go Soeda            Tatsuma Ito              
RSA      3      20110411  Johannesburg CH  Izak Van Der Merwe  Rik De Voest             
SWE      3      19931101  Aachen CH        Jonas Bjorkman      Jan Apell                
RUS      2      20100823  Astana CH        Igor Kunitsyn       Konstantin Kravchuk      
GBR      2      20050704  Nottingham CH    Alex Bogdanovic     Mark Hilton              
CAN      2      19991129  Urbana CH        Frederic Niemeyer   Sebastien Lareau         
IND      2      19990412  New Delhi CH     Leander Paes        Mahesh Bhupathi          
SLO      1      20120716  An-Ning CH       Grega Zemlja        Aljaz Bedene             
TPE      1      20111017  Seoul CH         Yen Hsun Lu         Jimmy Wang               
SVK      1      20100809  Samarkand CH     Andrej Martin       Marek Semjan             
NOR      1      19980601  Furth CH         Christian Ruud      Jan Frode Andersen       
ECU      1      19960715  Quito CH         Pablo Campana       Luis Adrian Morejon      
DEN      1      19960226  Hamburg CH       Kenneth Carlsen     Frederik Fetterlein      
MAR      1      19950814  Geneva CH        Younes El Aynaoui   Karim Alami              
MEX      1      19920427  Acapulco CH      Leonardo Lavalle    Luis Herrera

TennisAbstract.com update: If you like ATP stats, you’ll love the new leaders page.  It allows you to compare the ATP top 50 across nearly 60 different metrics, and filter matches in all the same ways you can on player pages.  Find out who hits the most aces on  clay, who plays the most tiebreaks in Masters events, who has faced the toughest opponents, or just spend the rest of your afternoon tinkering with the thousands of possible permutations.  It’s very much a work in progress, so (a) let me know if you have suggestions or come across a bug; and (b) don’t be shocked if I occasionally break it while trying to improve it.

Also, I’ve created a “current tournaments” page that aggregates all matches (completed and upcoming) at this week’s events.  It’s a great way to get a quick overview of what’s happening this week, and with next week’s qualifying draws released, you can also use the filters to zero in on, say, all Americans who are still alive in some ATP, WTA, or Challenger event.

Finally, don’t miss the Player Schedules page, which aggregates ATP and Challenger entry lists to show you who is playing where for the next six weeks.

The Historically Strong Dallas Challenger

All eyes are on Indian Wells this week, with seven of the top eight-ranked men in the world in the quarterfinals.  (Oh, and one epic streak coming to an end.)  Look a little deeper, though, and you’ll find another ATP event in progress, this one under the guise of a Challenger tournament.

By just about every metric imaginable, this week’s Dallas Challenger has one of the strongest Challenger fields ever assembled.  Many ATP 250s–and a few 500s–are barely at the same level.

Because of Dallas’s timing in between the opening rounds of Indian Wells and the beginning of the Miami Masters, special rules apply to tournament entries.  Higher-ranked players are able to make last-minute decisions to compete, hence the presence of the two top seeds, Marcos Baghdatis and Thomaz Bellucci.  Many other tour-level pros choose to make the stop in Dallas to get a couple of matches under their belt to compensate for a disappointing showing in the California desert.

Measuring field quality is tricky, but here we’re not working with subtle differences.  Here are some simple metrics we could use to the compare main draw strength of the 2500 or so Challenger events since 1991:

  • Average ATP Rank. In Dallas this year, it’s 103, the best ever in a Challenger event.  Second best is 109–that was the same event last year.  Only eight Challengers have ever had an average rank below 130, and the average is a whopping 290.
  • Median ATP Rank. Similar deal, without the risk of a few top players skewing the results.  Dallas’s median is 90; last year it was 90.5–best and second-best ever.  Only two others come in under 100, and the average is 239.
  • 8th seed ATP Rank. I like this metric as it indicates the presumed quality of the quarterfinals–every guy in the last 8 is either this good or has to beat someone this good.  Dallas’s 8-seed this year is #62 Lukas Rosol, the highest-ranked 8-seed ever in a challenger event.  Second place, once again, is the same event last year, where #69 Lukas Lacko was seeded eighth.  Only 18 events have ever had an 8-seed in the top 80, and the historical average is 180.
  • Average seed ATP Rank. Another angle: here Dallas is ousted, coming in 3rd of the 2500 events, at 48.  The 1991 Johannesburg Challenger (46.5) and 1994 Andorra Challenger (47.5) just barely beat it out.  Only 17 events have had an average seed rank better than 60, and the average is 145.
  • Number of top 50 players. Dallas is only the 3rd Challenger event to ever have five top 50 players, after 1991 Jo’burg and 2004 Dnepropetrovsk.  Only 66 Challengers have ever had multiple top-50 competititors, and fewer than 1 in 10 Challengers have a single one.  The average Challenger top seed is ranked #97.
  • Number of top 75/100/125 players.  12 players in the main draw this week are ranked in the top 75, 18 in the top 100, and 25 in the top 125.  All are either new records or tied with the old record.  The average challenger event has 0.13 top-50s, 0.57 top-75s, 1.71 top 100’s, and 3.81 top 125’s.

The one way in which this week’s tournament in Dallas doesn’t rank amongst the best is by a more sophisticated approach, the one that I use in my Challenger strength report on TennisAbstract.com.  By simulating the tournament draw several thousand times, we can estimate the likelihood of a certain level of player winning the event.  For instance, had the 50th-best player in the world entered the Burnie or West Lakes Challenger this year, he would have had about a 25% chance of winning.   But against the more competitive field in Quimper, that number drops to 12%–about the same as the 50th-best player’s chance in the unusually weak Los Angeles ATP event last year.

This week, Jurgen Melzer–ranked in the mid-40s on hard courts by my rating system–had a 9.3% chance of winning the title according to my pre-tourney simulations.  (Go to the tournament forecast page and click ‘R32’ under the ‘Forecast’ header.)  That puts Dallas comfortably among the top 10 toughest Challenger draws in the last year–and better than LA–but nowhere near the top.

It’s one thing to have a deep draw, but another thing entirely to have a tournament that is particularly hard to win.   For the latter, an event needs one or two very highly-ranked players, like Marin Cilic at last year’s Dallas Challenger, or Fernando Verdasco in Prostejov last year.  In theory, if not in practice, someone ranked in the top 20 should waltz to a title, offering an insurmountable obstacle to your typical Challenger-level player.

Dallas may not be the most difficult Challenger event to win, but by any measure of field quality and depth,  it’s one of the very strongest in ATP history.  The fans in Dallas are very fortunate this week.