2024 did not go as planned for Lorenzo Musetti. He started the season having fallen out of the top 20, and he didn’t win back-to-back matches until Miami. The skid continued on clay, where he suffered first-round exits in Estoril, Barcelona, Madrid, and Rome.
Somehow he found form on grass, reached the Wimbledon semis, then picked up a bronze medal at the Olympics. That was good enough for a return to the top 20, and with last week’s run to the Monte Carlo final, he’s on the cusp of the top ten. Elo already rates him that highly, and even though he is skipping Barcelona this week, he’s likely to rise from 11th to 10th on the ATP computer next Monday.
Some of the slump could be attributed to distraction: His partner had a baby in the middle of it. (Though that doesn’t explain his decision to play Challengers after losing early in Madrid and Rome.) He’s still just 23, so we could write off the losing streak to the grind of the tour. It takes time to adjust–especially to so much hard-court tennis–and Musetti’s early success might have raised expectations too early.
The oddest part, though, is the surface mix. Last February, I introduced a stat to measure “surface sensitivity“–how much a player’s results were influenced by surface speed. Not just surface type, but the degree to which a server could dominate. At the time, Musetti was the ultimate slow-court specialist. Guys like Rafael Nadal, Alejandro Davidovich Fokina, and Stefanos Tsitsipas showed strong preferences for the most stately surfaces. But Musetti was more extreme than any of them.
Then he went near winless on the dirt, and then he went 12-3 on grass. Predictions are hard, especially about the future.
Yet Musetti’s surface profile is sorting itself out. He excelled at the Paris Olympics, and in the best vindication of my surface sensitivity numbers, he came within a set of scoring his first major title in Monte Carlo. The principality hosts the slowest courts of any major ATP event; it’s no accident that Tsitsipas and Davidovich Fokina have thrived there as well.
Was 2024 a blip, and is he now Lorenzo, king of the dirtballers? Or is there more to the Italian’s game than slow-court success?
The one-hander
Musetti’s signature stroke is his one-handed backhand. He’s now the top-ranked guy with a one-hander, ahead of #16 Tsitsipas and #17 Grigor Dimitrov. Like those two, the Italian is a Federer acolyte.
Almost by definition, the Musetti backhand is lovely to watch. No winner looks better in a highlight reel than a one-handed backhand winner, and he delivers more than his share. Still, we have to ask: Is it any good?
The eye test says yes, but the eye test is not trustworthy when it comes to one-handers. Fortunately, the stats agree. My Backhand Potency (BHP) metric, which balances winners (plus forced errors) against unforced errors, as well as shots that precede one or the other, puts Musetti among the top third of ATP regulars:
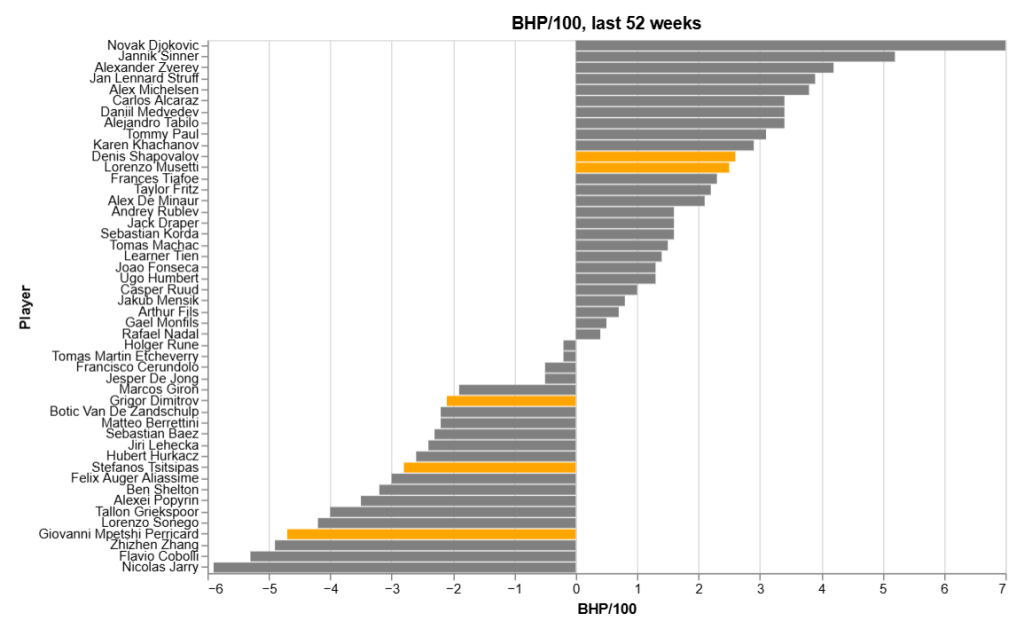
The chart shows BHP per 100 backhands for all players with at least 10 charted matches in the last 52 weeks. That includes five guys with one-handed backhands, highlighted in orange. Among those, only Denis Shapovalov is close to the Italian. The other three are in negative territory.
(You can look up other players on the career list. Federer and Stan Wawrinka are both around neutral. Richard Gasquet stands at +2.0, close to Musetti’s current level.)
We don’t have BHP for every match, but there are signs that Musetti’s backhand was particularly effective last week. The stat reached +5.5 in both his second-rounder against Jiri Lehecka and the final against Alcaraz. Whatever the limitations of the one-handed backhand in general, the shot isn’t holding the Italian back.
The best defense…
Topspin backhands, even pretty ones, are best in moderation. Given a choice, just about everyone this side of Alexander Zverev will hit a forehand instead. It’s particularly important to pick the right spots with a one-hander, as the stroke takes more time to prepare. It is also less forgiving when the timing isn’t perfect.
While no single formula applies to everyone, the ideal player will run around some backhands in favor of their forehand, and they’ll skip other backhands in favor of more conservative slices. Here’s how Musetti ranks against his peers over the last year–and the career numbers of a few all-time greats–as measured by forehands-per-groundstroke and slices-per-backhand:
Player              FH/GS  BH Slice%
Grigor Dimitrov     48.5%      55.4%
Lorenzo Musetti     50.5%      39.4%
Stefanos Tsitsipas  52.4%      22.3%
Mpetshi Perricard   55.1%      32.4%
Denis Shapovalov    56.8%      32.4%

Career:
Roger Federer       48.8%      37.0%
Richard Gasquet     45.0%      22.9%
Stan Wawrinka       49.9%      31.3%
The Federer number reminds us that FH/GS isn’t about how often a player would prefer to hit a forehand. Everybody targets the backhand, and the worse your backhand, the more they take aim. So Fed’s 48.8% is what results when far more than half of shots were aimed at that side. He slipped around them for as many forehands as he could justify.
The Italian’s numbers are surprisingly close to both Fed’s and Wawrinka’s. He manages to hit a few more forehands–perhaps because the data we have for him is skewed a bit toward clay–and he slices more than Roger did. That’s a clue as to why Musetti can hold his own on grass: He’s right at home prolonging points with slice backhands.
Forehand-finding is also a clue as to why Lorenzo’s fortunes are on the uptick. Here’s a selection of his FH/GS rate in recent notable clay-court matches:
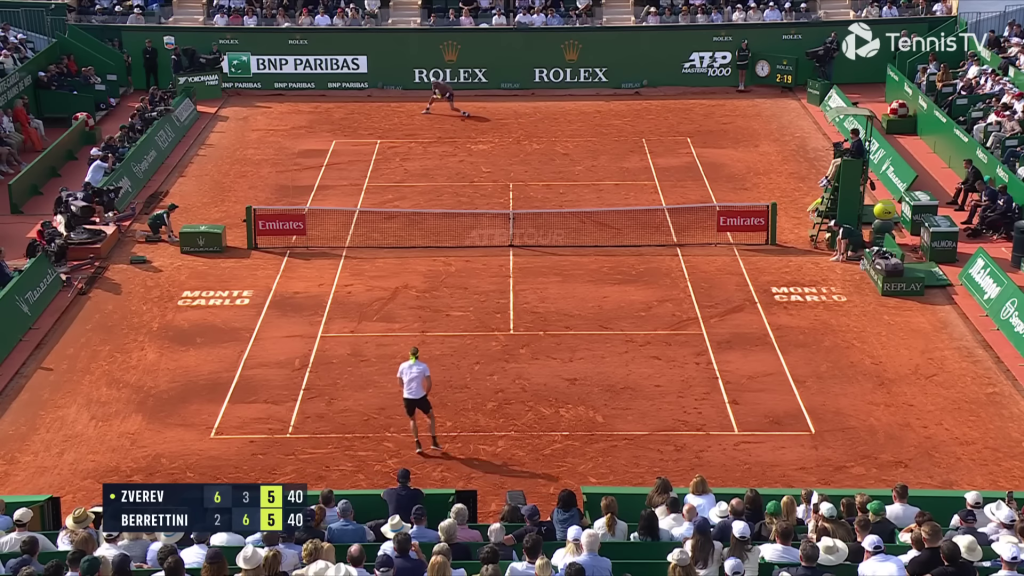
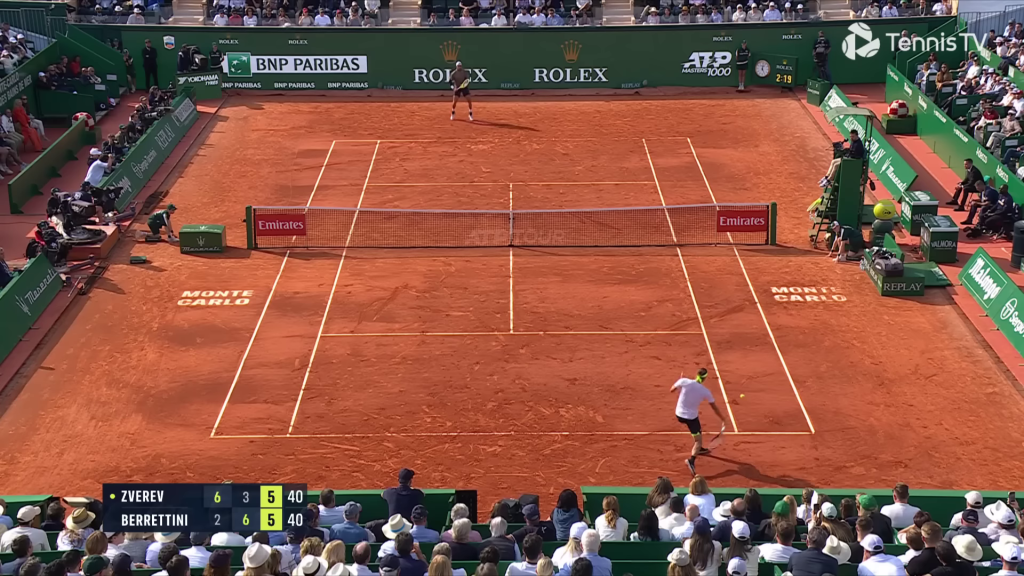
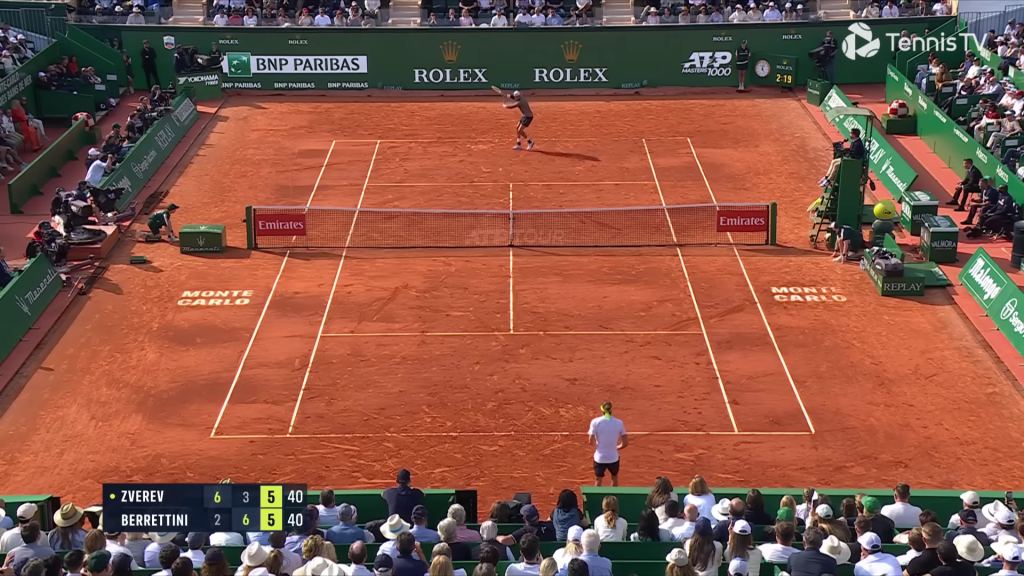
Match                 Result          FH/GS
2025 Monte Carlo F    L vs Alcaraz    62.0%
2025 Monte Carlo R32  W vs Lehecka    56.0%
2024 Olympics BR      W vs FAA        49.2%
2024 Olympics SF      L vs Djokovic   44.9%
2024 Olympics QF      W vs Zverev     44.8%
2024 Umag F           L vs Cerundolo  41.8%
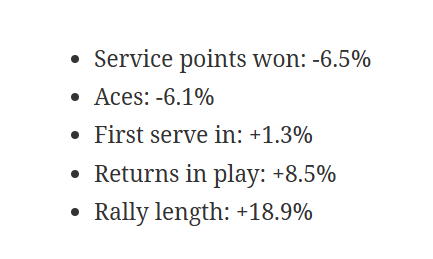
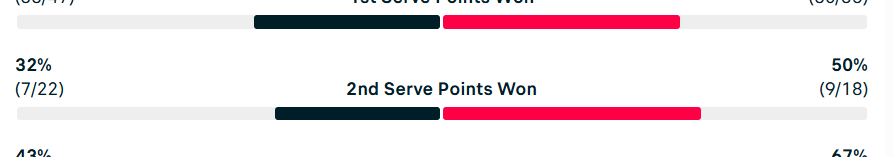
The Alcaraz match is a tough one to parse, because the stats incorporate Musetti’s attempt to play it out with an injury. But though he lost, he was right there with the Spaniard for the first ten or eleven games. He only needed to hit two plus-one backhands in the entire first set.
However we handle the Monte Carlo final, it should be clear by now that there’s a big difference between 45% and 55% forehands. At 45%, opponents are trying to exploit that wing and the player is happy to hit backhands, a la Zverev or Daniil Medvedev. The Italian may finally be taking a page from the playbooks of compatriots Matteo Berrettini and Lorenzo Sonego, saving his backhand for when he really needs it.
Going hard?
If Musetti is going to make a permanent home in the top ten, he’ll need more hard-court wins. He could get by with an annual romp through clay season, especially if he continues to rack up wins on grass. But the latter seems like a big ask, and there just aren’t enough events on dirt these days for a single-surface guy to find stardom.
The Italian does have a hard-court title: Naples in 2022, where he beat Berrettini in not-so-fast conditions. He added a final last year on speedy courts in Chengdu; the caveat there is that he didn’t face a single top-40 opponent.
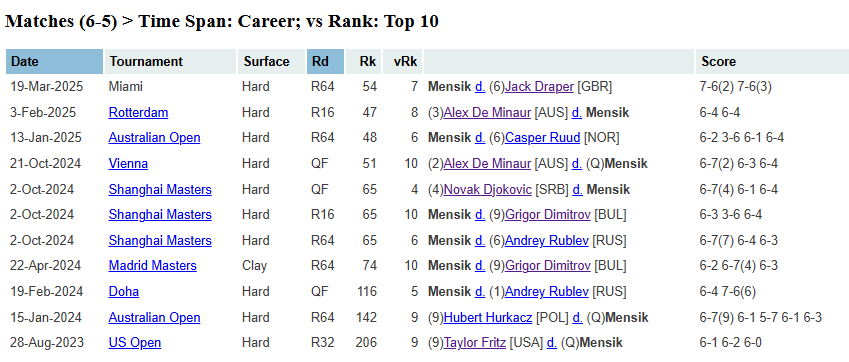
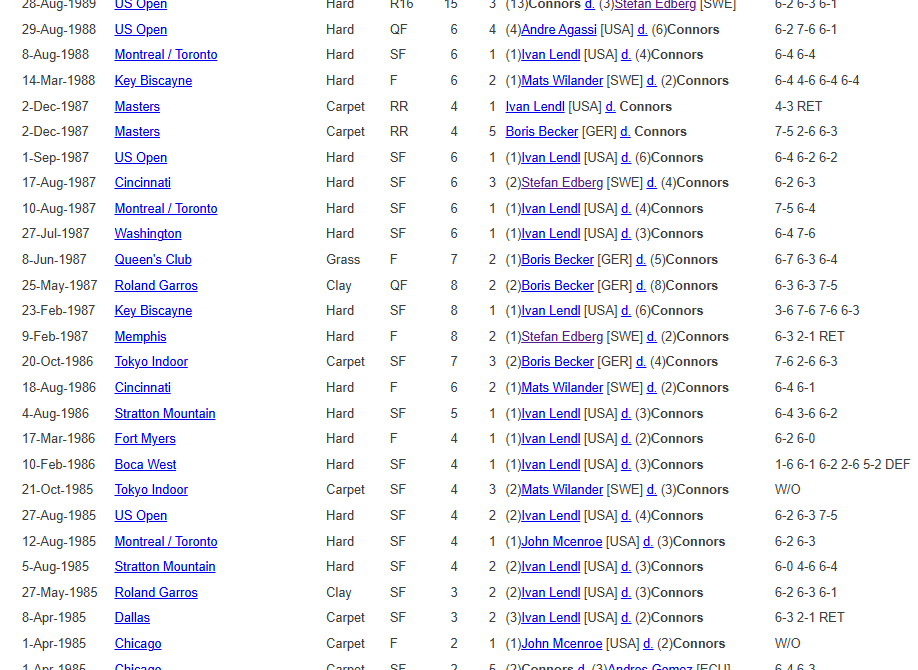
Bigger picture: Musetti is 3-11 against top-tenners on the surface, and those three wins don’t inspire confidence. He knocked out a passive Zverev in Vienna last year, beat Casper Ruud in Paris, and got past Diego Schwartzman back in 2021. In those 14 matches, he won fewer than 57% of service points. None of the wins were straight-setters, and all of the losses were.
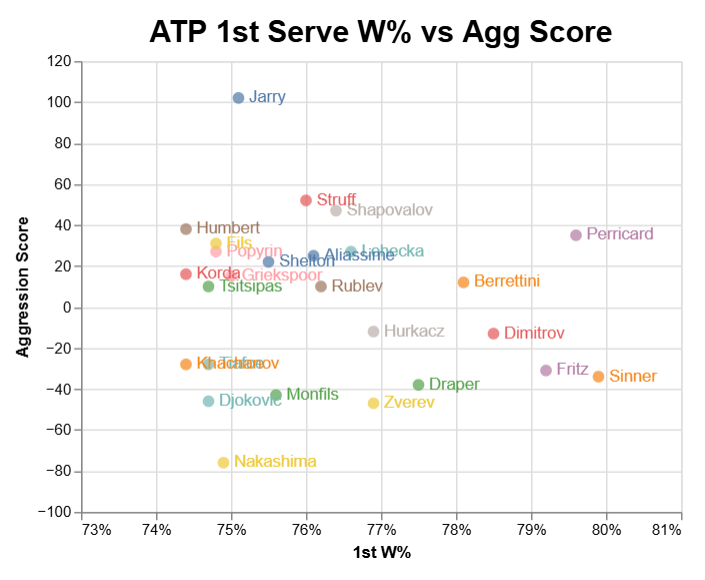
His game, let’s face it, was made for clay. He’s one of the most passive players on tour. Here are the tour’s least aggressive players–by rally aggression score, a measure of how often the player ends points for good or bad, scaled between -100 and +100–over the last 52 weeks, minimum ten charted matches:
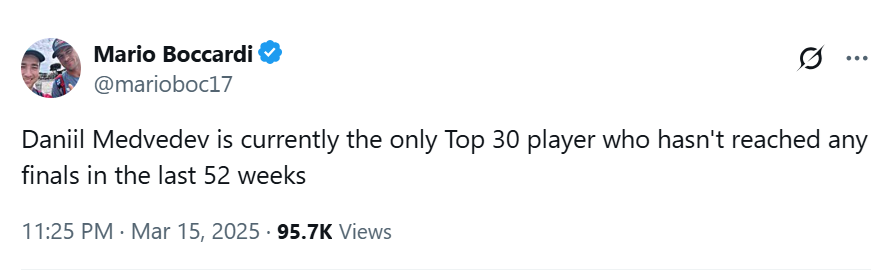
Player            RallyAgg
Daniil Medvedev        -93
T M Etcheverry         -79
Alex de Minaur         -73
Lorenzo Musetti        -58
Sebastian Baez         -53
Rafael Nadal           -53
Alexander Zverev       -47
Gael Monfils           -46
Novak Djokovic         -46
Marcos Giron           -45
Musetti is less aggressive than Zverev. Less aggressive than Sebastian Baez. He hasn’t scored above average on this metric for a single non-grass match in two years.
In other words: He lets the game come to him, and alas… it does.
The tour’s most common surface may be the achilles heel of the one-handed backhand. It is of course possible to win on hard with a one-hander, as Federer showed us for the better part of two decades. To grossly oversimplify, he did it by hiding that backhand. Tstisipas’s recent resurgence in Dubai came from maxing out the aggression on that wing.
You can win on hard courts with passive tennis–go Medvedev!–or you can win on hard courts with a well-shielded one-hander. But it is increasingly clear that you can’t do both. Musetti has proven his potential on both of the game’s natural surfaces, showing off the value of both topspin and slice groundstrokes to do so. That’s enough to make him a top-tenner–barely. To win on hard courts, he will need more Federer-esque tactics to go with his Roger-inspired backhand.
* * *
Subscribe to the blog to receive each new post by email: