How To Play One-Set Shootouts Like Daniil Medvedev

Daniil Medvedev in 2023, practicing… something. Credit: Hameltion

In yesterday’s Australian Open quarter-final match against Hubert Hurkacz, Daniil Medvedev came through with his second five-set win of the tournament. In the decider, Hurkacz’s level dropped, Medvedev kept his ground game tight, and the Russian converted the one break point on offer. Four hours of tennis, compressed into a few crucial moments, and Medvedev has a place in the semi-finals.

Not long ago, Medvedev gained a reputation as a disappointment in deciding sets. He lost 11 of 15 three- and five-setters in 2022, and yesterday’s match was the first time in nine tries–going back to Melbourne two years ago–that he had beaten a top-ten player in a climactic set.

But such trends are easy to exaggerate. For one, three of those eight consecutive losses were clustered at the 2022 Tour Finals, where the Russian managed, remarkably, to drop third-set tiebreaks in all of his round-robin matches. Not the best way to ensure a restful offseason, but hardly an indictment of his ability to hang around late into matches with the best players in the game.

Further, except for the 2022 season, Medvedev has developed a knack for cleaning up close matches with everybody else:

Year   Decider W-L  Decider W%  
2024           2-0      100.0%  
2023          14-6       70.0%  
2022          4-11       26.7%  
2021          14-5       73.7%  
2020           9-4       69.2%  
2019         10-11       47.6%  
2018          16-9       64.0%  
2017          13-6       68.4%  
2016          23-9       71.9% 
---- 
Total       105-61       63.3%

2016 shouldn’t really count, since it’s a mix of ITFs, Challengers, and early forays onto the main tour, but given the results, I figured it was worth including. Wherever you draw the line, it’s hardly the case that Medvedev struggles in such matches. Recently, I looked into what a player’s third-set record “should” be, given their skill level, and a mark above 60% is better than expected for nearly anyone.

You might argue that the Russian shouldn’t have racked up so many deciders. He was expected to finish off Emil Ruusuvuori much more quickly than he did in the second round in Australia, and even on clay, he should never have gotten dragged to a fifth set at Roland Garros by Thiago Seyboth Wild, much less lost it. But everyone takes the scenic route sometimes. 14 of Medvedev’s deciding sets last year came against the top 50, 10 of them against the top 20.

The final set shift

When a match is reduced to a one-set shootout, it becomes a bit less serve-centric. This is a persistent finding in all high-pressure situations, from tiebreaks to break points to fifth sets. Servers get a bit more cautious, returners heighten their focus, and quick points are harder to come by.

The effects are small but real. In the 1,200-plus men’s deciding sets since 2017 logged by the Match Charting Project, servers win 1.1% fewer points in the final set that they did in the first two or four. They land fractionally more of their first serves, but only by increasing their margins: The percent of unreturned serves falls by more than 5%. The average rally increases from 4.1 strokes to 4.3.

There are two fundamental ways to benefit from those changes. First, you can buck the trend, continuing to serve big while your opponent succumbs to the natural tendency toward caution. That’s part of the reason that John Isner and Roger Federer were two of the very few players to win more tiebreaks than expected over long periods of time. It’s not easy, especially if fatigue is setting in. But if you can keep serving the way you did for two or four sets, you have a minor edge in the decider.

Second, you can be the type of player who excels in deciding-set-style tennis. If you had to pick between Medvedev and Hurkacz in a contest where more serves would come back and points would last longer, the choice is simple, right? It’s no guarantee, to be sure: The shift is a minor one, and it may not show up in any given match. Yesterday, more points were decided in four shots or less in the fifth set than in the first four. But on average, the trend moves in the other direction, right into the Russian’s wheelhouse.

Evidence shows that Medvedev follows these prescriptions, maintaining his attack on serve while taking advantage of more cautious opponents. Other top players, to varying degrees, do the same.

Let’s start with the basics. For each stat, I calculated every player’s performance in deciding sets, and in all previous sets. The numbers I’m about to show you are the ratio between those numbers, a measure of how much their tactics change when the final set begins. Positive numbers mean they do more of it in the decider, negative means they do less. We’ll look at the four Australian Open semi-finalists, plus Carlos Alcaraz (because of course) and Hurkacz (because of his deciding-set notoriety). Keep in mind that Novak Djokovic’s figures are limited to matches since 2017.

Here are the rate of serve points won, and the rate of first serves in:

Player             SPW%  1stIn%  
Carlos Alcaraz     3.9%    4.4%  
Jannik Sinner      2.6%   -1.2%  
Novak Djokovic     1.5%   -1.1%  
Hubert Hurkacz     0.8%   -1.9%  
-- Average --     -1.1%    0.7%  
Daniil Medvedev   -1.2%   -1.7%  
Alexander Zverev  -4.5%    3.2%

Medvedev is in line with tour average when it comes to winning service points: He doesn’t hold on to as many in deciding sets. Average isn’t bad in this case, though it looks mediocre in this company. A more encouraging sign, at least in terms of the tactical approach, is the change in first serves in. The Russian, in line with Djokovic, Hurkacz, and Jannik Sinner, seems to take a few more chances in the shootout. Alcaraz defies gravity, serving more conservatively yet winning more points, and Zverev looks out of place, a caricature of prudence.

Now let’s look at the percentage of serves that don’t come back (Unret%), as well as the percent of service points won in three shots or less (SPW% <=3):

Player            Unret%  SPW% <=3  
Novak Djokovic     10.9%      5.4%  
Carlos Alcaraz      0.2%      1.0%  
Daniil Medvedev    -0.6%     -2.0%  
Hubert Hurkacz     -1.1%      0.2%  
-- Average --      -5.7%     -3.6%  
Jannik Sinner      -7.4%      0.3%  
Alexander Zverev  -13.4%    -11.2%

The first rule of writing about men's tennis: Whatever the topic, you'll eventually end up showering praise on Djokovic. In recent years, he has learned how to get more out of his serve, and he turns that knob even further in deciding sets. Most players struggle to simply stay above water in the final set; Djokovic starts serving bigger.

Medvedev's rate of unreturned serves is the sort of positive sign it takes a connoisseur to appreciate: "-0.6%" doesn't turn up on many Hall of Fame plaques. But when the typical player serves so much more carefully, the Russian's consistency works to his advantage. His three-shots-or-less win rate does not stand out as much, but it is still less of a step backward than the typical tour player takes.

Once again, deciding-set Alexander Zverev is an unusual beast.

Opportunistic returning

If the challenge on serve is to keep attacking in the final set, the task on return is to take advantage of an opponent who probably isn't doing that. Ideally, that might mean more aggression on the return, but a 1% or 5% weaker first serve is still only so playable. Instead, players should make sure not to squander the chances they're given: Make more returns, then tighten up the ground game for the inevitable rallies.

Here are three stats to illustrate deciding-set return tendencies, again expressed as ratios between how each player performs in the final set, compared to previous sets:

Player            Ret InPlay%  UFE/Pt    FH%  
Alexander Zverev         6.7%    1.1%   1.0%  
Daniil Medvedev          3.9%   -3.2%  -1.2%  
Novak Djokovic           3.0%  -10.5%   1.5%  
Hubert Hurkacz           2.9%   -1.7%   0.3%  
Carlos Alcaraz           2.7%  -10.4%  -1.9%  
-- Average --            2.5%   -2.4%  -0.3%  
Jannik Sinner           -1.2%    0.1%   0.4%

Zverev, as we might have guessed, gets a lot of deciding-set returns in play. He's exceedingly conservative by every other measure we've seen, so why not here? Behind him, heading the non-pusher category, is Medvedev, who gets nearly 4% more returns in play in the final set that he did up to that point.

Unlike Zverev, the Russian also stays in control throughout the rally. He doesn't suddenly discover the otherworldly control of Djokovic and Alcaraz, who somehow reduce their unforced error rates by 10% in the deciding set, but he leads the rest of the pack, cutting down his mistakes by more than the tour average.

The third metric shown here--forehands as a percentage of all groundstrokes--is simply a curiosity. There's no right or wrong way to choose strokes, at least not at the level of the whole tour. As we saw last week, Medvedev and Zverev go for backhands on the plus-one shot more than anyone else, because they are in the unusual position that it might really be their stronger option. If a player improves his ground game in the fifth set--and this is nothing more than a hypothesis--it might show up in the numbers as more shots from his preferred wing. None of these men show a dramatic shift in shot selection, but I can't help but notice that Medvedev hits a few more backhands in the final set than he did in the two of four sets it took to get there.

If Medvedev reaches a fifth set in tomorrow's semi-final against Zverev, he won't need this level of savvy to know what's going on. The German's tactics, whether by design or instinct, are abundantly clear. Zverev can turn a shootout into a war of attrition, with two fifth-set tiebreaks already in Melbourne and an astonishing record of 22 deciding sets won in his last 26 attempts. While it will doubtless be a grind, the Russian might just be able to use his opponent's passivity against him. Faced with the tiny margins of a grand slam fifth set, every edge is worth exploiting.

* * *

Subscribe to the blog to receive each new post by email:
 

How Coco Gauff Escaped a Trap of Her Own Making

Also today: Jannik Sinner’s near-unbreakability

Coco Gauff at the 2022 US Open. Credit: All-Pro Reels

Coco Gauff is not a pusher, but she can do an awfully good impression of one. In yesterday’s Australian Open quarter-final against Marta Kostyuk, the American coughed up 50 unforced errors against just 17 winners. The average rally lasted 4.6 strokes, a modest number that was rescued from marathon territory only by Gauff’s many unreturned serves.

Coco’s forehand, the usual culprit when things get messy, was on full display yesterday. While the stroke has shown signs of improvement–only 9% of them contributed to the unforced error tally, below both tour average and Gauff’s own standard–it remains loopy, and it gets ever-more cautious under pressure. Kostyuk was willing to go after the high-bouncing mid-court groundstrokes, often putting Gauff on the run. Fortunately for the American, her defense rarely deserts her. She eked out a three-hour, 7-6, 6-7, 6-2 victory for a place in the Melbourne semi-finals.

My impression watching the match was that Gauff put an unreasonable number of returns–especially forehand returns–in the middle of the court, not too deep, and that Kostyuk was punishing them. I was partly right: The Ukrainian forced Coco to hit forehand after forehand against the serve, more than two-thirds of her service returns all told. Gauff did indeed send more of those balls down the middle, closer to the service line than the baseline. And Kostyuk attacked… but to little avail.

Let’s get into the numbers. The Match Charting Project divides the court into thirds, both in terms of direction (forehand side, backhand side, and middle) and depth (shallow [in the service boxes], deep [closer to the service line than the baseline], and very deep). All else equal, shots deep and/or to the sides of the court are better, though of course they are riskier. Some returns will inevitably end up down the middle and shallow; the goal is only to avoid it when possible.

Here is how Gauff’s performance yesterday compared to tour average and her own typical rate of service returns that went down the middle and didn’t land close to the baseline:

RETURNS          Middle/Not Very Deep  
Tour Average                    34.0%  
Coco Average                    40.5%  
Coco vs Kostyuk                 43.7%

Indifferent return placement is nothing new for the American, and she left even more hittable plus-ones for Kostyuk than usual. It wasn’t as bad as last year’s US Open final against Aryna Sabalenka, when Gauff put more than half of her returns in the less effective zones, but Kostyuk is no Sabalenka when it comes to imposing her will with the serve.

Return placement matters. On average, tour players win 46% of points when they land a down-the-middle, not very deep return. When they put the ball anywhere else–closer to the baseline or a sideline–they win 56%. Gauff is a little better behind the weak returns, but for her career, the gap is still present: 47% versus 55%.

Except… that isn’t what happened yesterday!

RETURN OUTCOMES  Mid/NVP W%  Better W%  
Tour Average          46.2%      56.3%  
Coco Average          46.9%      54.8%  
Coco vs Kostyuk       60.0%      55.2%

When Gauff placed a return near a line, her results yesterday were typical. But Kostyuk was unable to capitalize on the rest. Among 88 matches logged by the Match Charting Project, Gauff has won 60% of those middle/not-very-deep returns only a dozen times, usually in blowouts.

Judging from the American’s performance on return, she could have made quick work of yesterday’s contest, too. The sticking point came on her own side of the ball, where her non-committal forehands didn’t work out as well.

Minus-ones

On the WTA tour, when the return lands in play, the server has nearly lost her advantage. A good first serve can give her a lingering edge, or a well-placed return can tilt the balance in the other direction, but overall, the point begins again as a neutral proposition. Servers win 52% of those points.

Gauff, on average, does a little better, converting her serve 53% of the time. There are signs she’s improving, as well. In the US Open final against Sabalenka, she won 55%, and in the Auckland final this month versus Elina Svitolina, she picked up 59%. Apart from lopsided matches, the high-50s are the best anyone can do on an ongoing basis: Iga Swiatek’s average is 57%, and Sabalenka’s is 55%.

Coco won 39% against Kostyuk.

Gauff’s lack of confidence in her forehand showed up in multiple ways. First, she didn’t use it as much as a plus-one weapon. She usually hits 57% of her plus-one shots from the forehand side, in line with tour average. Yesterday, that rate was just 51%, something that had more to do with her own choices than any return magic that Kostyuk conjured up.

Then, she didn’t do much with those forehands. The following table shows plus-one forehand rates (3F%), the percentage of plus-one forehands hit down the middle (FH Mid%), and the server’s winning percentage (FH Mid W%) behind those down-the-middle forehands:

PLUS-ONES          3F%  FH Mid%  FH Mid W%  
Tour Average     56.6%    29.9%      45.9%  
Coco Average     57.2%    35.0%      47.0%  
Coco vs Kostyuk  50.7%    39.5%      40.0% 

Gauff magnified her own tendency to go back down the middle with her second-shot forehand. It didn’t work, as she won just 40% of those points, compared to her typical rate of 47%.

Even beyond the plus-one, Coco just kept pushing the forehand. She went down the middle with 46% of her forehands, compared with her usual 37% and the tour average of 28%. She won barely one-third of the points when she did so, partly because of the nine unforced errors she racked up playing an already conservative shot. Two of those missed down-the-middle forehands came on back-to-back points when she could hardly afford them, taking her from 15-all to 15-40 when trying to close out the match at 5-3 in the second set.

In the end, as we’ve seen, Gauff’s defense saved her. She won more than half of Kostyuk’s serve points despite lackluster returning. Had she served just a little better–she missed six straight first serves in that 5-3 game–she would have finished the job an hour sooner. Had she attacked a bit more effectively with her second shots, even the off-day from the line wouldn’t have amounted to much.

To state the obvious: She’ll have to play better to beat Sabalenka in tomorrow’s semi-finals. One thing, at least, will work in Coco’s favor: She’ll have many fewer choices to make. The defending champion will dictate play and give her less time to think than Kostyuk did. Gauff withstood the Belarusian barrage in New York, winning the US Open title despite a couple of detours against less aggressive players in the early rounds. The American can’t play tomorrow like she did yesterday, but thankfully, Sabalenka won’t let her.

* * *

Jannik Sinner’s near-unbreakability

Jannik Sinner has lost his serve just twice en route to the Australian Open semi-finals. He has faced 28 break points and saved 26 of them.

Since 1991, when the ATP started keeping the relevant stats, he is the 26th player to reach the final four at a major with so few breaks of his own serve:

Tournament  Semi-finalist       BP Faced  Broken  
2013 USO    Rafael Nadal               6       0  
2018 Wimb   John Isner                 7       0  
2015 Wimb   Roger Federer              3       1  
1994 Wimb   Pete Sampras               9       1  
2015 AO     Novak Djokovic            11       1  
2014 Wimb   Roger Federer             12       1  
1997 Wimb   Pete Sampras              12       1  
2010 USO    Rafael Nadal              14       1  
2012 RG     Rafael Nadal              17       1  
2004 Wimb   Roger Federer             17       1  

Tournament  Semi-finalist       BP Faced  Broken  
2014 Wimb   Milos Raonic               9       2  
2011 RG     Novak Djokovic*            9       2  
2007 USO    Roger Federer              9       2  
2006 Wimb   Roger Federer              9       2  
2006 Wimb   Rafael Nadal               9       2  
2015 USO    Roger Federer             11       2  
2014 AO     Roger Federer             11       2  
1997 USO    Greg Rusedski             11       2  
1993 AO     Pete Sampras**            12       2  
2013 Wimb   JM del Potro              13       2  
2019 AO     Rafael Nadal              15       2  
2008 Wimb   Roger Federer             15       2  
2005 AO     Andy Roddick              15       2  
1998 Wimb   Pete Sampras              17       2  
2000 AO     Yevgeny Kafelnikov        22       2  
2024 AO     Jannik Sinner             28       2

* Djokovic won one round by W/O and another by retirement
** I don't have stats for Sampras's QF, but the final score suggests that he wasn't broken

Pretty good company! As the table makes clear, though, Sinner’s 28 break points faced is not so elite. In fact, the average major semi-finalist faces exactly 28 break points in his first five matches.

The Italian’s accomplishment, then, is saving so many. 26 of 28 is a 93% clip, and that is more rarefied air:

Tounament  Player      Faced  Saved   Save%  
2013 USO   Nadal           6      6  100.0%  
2018 Wimb  Isner           7      7  100.0%  
2012 RG    Nadal          17     16   94.1%  
2004 Wimb  Federer        17     16   94.1%  
2010 USO   Nadal          14     13   92.9%  
2024 AO    Sinner         28     26   92.9%  
2014 Wimb  Federer        12     11   91.7%  
1997 Wimb  Sampras        12     11   91.7%  
2015 AO    Djokovic       11     10   90.9%  
2000 AO    Kafelnikov     22     20   90.9%

Things will get tougher on Friday, when Sinner faces all-time-great returner Novak Djokovic for a place in the final. Then again, Djokovic failed to convert his first 15 break points against Taylor Fritz yesterday–maybe he was just preparing for the matchup with Sinner.

* * *

Subscribe to the blog to receive each new post by email:
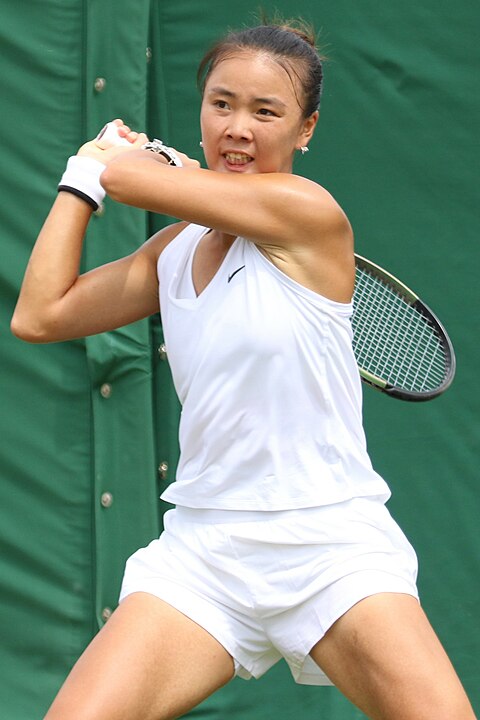
 

Can Lorenzo Sonego Hunt Down Enough Forehands?

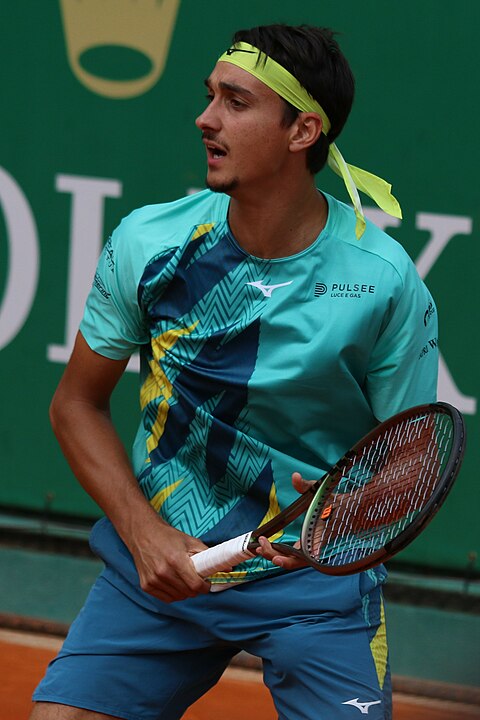
Lorenzo Sonego at Monte Carlo in 2022. Credit: si.robi

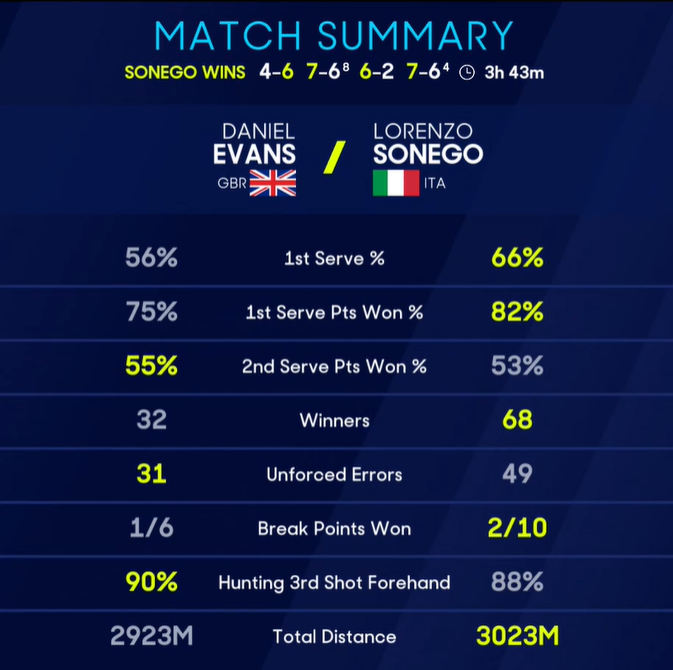
This year, Australian Open broadcasts threw a screwball into their traditional post-match statsheet. In the addition to the usual numbers–winners, unforced errors, break points won, and so forth–the graphic shows something called “Hunting 3rd Shot Forehand.” I must have missed a memo. This is the first I’ve heard of such a thing.

A puff piece for the Tennis Australia data group offers something of a definition. The new stat measures “the times the server forehands their first post-serve hit, indicating their desire to dictate the point.” Um, ok. In other words, when the service return comes back, how often does the server hit a forehand with his next shot?

The intention behind the metric is straightforward. You hear a lot these days about the “plus-one”–the server’s second shot. While the serve is the most important stroke in tennis, the plus-one shot is the next-most crucial opportunity to attack. Both because it arises often, and because it offers a chance to define the direction of the rally, even if it’s not yet possible to put the ball away.

It is easier to dictate play with a forehand than a backhand; the potential trajectories of the stroke give a player more options. Beyond that, most men have better forehands than backhands. (The stat appears on broadcasts for both men’s and women’s matches, but today I’m going to talk about the men’s game.) If the goal is to command the rally with the plus-one shot, it’s better to hit a forehand than a backhand. A higher “Hunting 3rd Shot Forehand” number, then, is better.

The post-match graphic, with new stat second from the bottom

Before we go further: I simply can’t use this name. It’s long and confusing. (Is the player hunting for the forehand? For a winner? For a silly rabbit?) I’m going to call it “3rd Shot FH%” or “3F%” for short.

(And yes, I promise to get to Sonego eventually.)

The stat is not as straightforward as the intention behind it. The implication of 3F%, I think, is something like, “How hard did the player try to hit plus-one forehands?” A possible further implication is, “How well did the returner prevent his opponent from hitting plus-one forehands?” The second question prompts yet another: “How well did the server keep the returner from sending balls to his backhand?”

It may be possible to separate some of those questions, but there’s a lot more spadework to do before we get there.

What is normal?

(You might doubt whether I am well-situated to answer. Still, we soldier on.)

Your TV screen shows you some “Hunting 3rd Shot Forehand” numbers. Are they good?

The 3F% metric can be calculated from Match Charting Project data, so we have thousands of data points to draw upon. Based on men’s matches since 2014, the average 3F% is 64.7%. The middle third of player-matches falls between 59.3% and 70.9%. Take a little liberty with rounding, and we can say that “normal” is the range from 60% to 70%. Less than 60%, and you’re doing something wrong–or you’d rather hit your backhand, or your opponent had a day. More than 70%, and you were really getting things done in the plus-one department.

Some players consistently land at the far ends of the distribution. Here are career numbers for the top ten active players by this metric, along with 15 more names of interest:

Player                3F%  
Lorenzo Sonego      78.6%  
Rafael Nadal        77.7%  
Joao Sousa          77.6%  
Denis Shapovalov    77.1%  
Albert Ramos        76.0%  
Jeremy Chardy       75.7%  
Milos Raonic        74.6%  
Stefanos Tsitsipas  74.4%  
Casper Ruud         73.9%  
Grigor Dimitrov     73.9%  
* * * * * * * * * * * * *                    
Holger Rune         69.7%  
Dominic Thiem       69.3%  
Hubert Hurkacz      67.5%  
Carlos Alcaraz      67.2%  
Andrey Rublev       64.7%  
Jannik Sinner       62.6%  
Alex de Minaur      61.2%  
Stan Wawrinka       60.9%  
Andy Murray         60.0%  
Taylor Fritz        58.3%  
Diego Schwartzman   56.9%  
Novak Djokovic      56.2%  
Frances Tiafoe      55.8%  
Alexander Zverev    51.1%  
Daniil Medvedev     50.0%

There’s Lorenzo!

The top of the list gives you an idea of what sorts of game styles result in lots of plus-one forehands. Big serves help. Left-handedness works in your favor, perhaps since everyone trains so hard to return to a right-hander’s backhand side. Some clay-courters do well, as they are less likely to think of the serve as a point-ending shot on its own, focusing instead on how it can set up the point.

It also helps to try to hit plus-one forehands. Neither Zverev nor Medvedev seem to think in those terms, so their low 3F% ratings don’t reflect any lack of execution.

Does this even matter?

Some valuable on-screen real estate–and an enormous amount of coaching time–would be wasted if 3F% didn’t correlate with points won. Fortunately for the conventional wisdom, it does: A plus-one forehand is more likely to lead to a point for the server than a plus-one backhand is.

57.5% of plus-one forehands eventually turn into a point won, compared to 50.9% of plus-one backhands. That’s a ratio of 1.13, a number that will be more useful as a reference point in a moment.

The value of a plus-one forehand depends on the player. Matteo Berrettini wins 58.5% of plus-one forehand points but only 44.6% of plus-one backhands. That’s a ratio of 1.31, one of the highest of any active player. For him, 3F% certainly matters: All else equal, more plus-one forehand points leads to better results overall.

(A word of caution, though: The marginal plus-one forehand point–that is, the next return that he might have ran around to hit a forehand, but didn’t–might not have improved his results for the better. Presumably Matteo knows his own capabilities, and he hits forehands only on those points where they improve his odds of winning. The marginal plus-one forehand, for a player like him, is a fairly desperate foray into the doubles alley.)

For others, the plus-one choice barely registers. Zverev wins 56.7% of plus-one forehands and 52.8% of backhands, a ratio of 1.07. Every other top-tenner has a wider split, but there are more extreme examples. Adrian Mannarino wins more points behind his plus-one backhand than forehand, 55.4% to 52.3%.

Sonego, our 3F% champion, gains nearly as much from his plus-one forehands as Berrettini does. He wins 57.1% of plus-one forehand points, against 44.4% for backhands. It isn’t easy to find his backhand, but it’s worth the attempt.

What about first and second serves?

As far as I know, broadcasts don’t separate the “Hunting” metric into first and second serves. But they should! Early in the rally, the effect of the serve retains plenty of influence.

The following table shows some of the tour-wide averages I’ve discussed so far–3F%, plus-one forehand points won, and plus-one backhand points won–broken down into first-serve and second-serve points:

AVERAGES     3F%  FH W%  BH W%   
1st serve  71.1%  60.3%  53.9%  
2nd serve  55.2%  52.2%  48.1%
Total      64.7%  57.5%  50.9% 

Bigger serves generate weaker (and less targeted) returns, which invite more forehands. Behind second serves, ATPers only manage to hit forehands on 55% of their plus-one shots. On the other hand, the gap in points won isn’t as wide.

A fascinating outlier is Andrey Rublev. He finds the forehand on over 80% of his first-serve points, one of the highest numbers on tour. Behind the second serve, though, he hits plus-one forehands only 43% of the time–one of the lowest! It’s no secret that his second serve is a liability, but such a gap still comes as a surprise.

Sonego is a more typical case: lots more plus-one forehands on the first serve than the second (83% to 71%), and a wide gap in the results between forehands and backhands regardless of which serve it supports.

Converting from the backhand corner

With a few exceptions like Mannarino, most players want to hit as many plus-one forehands as they plausibly can. If the return goes to their forehand corner, obviously they’ll hit a forehand. If the return comes back up the middle, it’s either a no-doubt forehand or an easy decision to take a couple of steps around the ball and avoid the backhand.

The real decisions happen when the return goes to the backhand corner. Now we’ve moved into true Match Charting Project territory. I don’t know if the Australian Open has the data to drill down this far; either way, it probably won’t show up on your TV screen. In this corner of the internet, though, we’ll dive in.

About one-quarter of in-play returns go to the server’s backhand corner. Ernests Gulbis set the standard for plus-one backhanding, running around just 2% of those balls. On average, players go for the forehand 26.6% of the time. Even Zverev and Medvedev go that route sometimes: 9% for the German and 8% for the Russian.

Here again, Sonego sets the standard. He runs around 49% of those returns, winning 53% of the resulting plus-one forehands versus 47% of the backhands he can’t avoid. No other active player creates so many forehand opportunities. Of retired players in the charting dataset, only Carlos Moya and Leonardo Mayer were more extreme.

Here’s the same tour-averages table as above, now limited to points with returns to the backhand corner:

BH CORNER    3F%  FH W%  BH W%  
1st serve  34.9%  61.3%  53.0%  
2nd serve  16.9%  52.3%  47.3% 
Total      26.6%  58.7%  50.0%  

It’s possible that many players–though probably not Sonego–are leaving some points on the table here. I’m surprised to see that the gap in win percentages between plus-one forehands and backhand is bigger for backhand-corner returns than returns in general. Backhand-corner returns are somewhat similar to each other–certainly more similar than returns in general. Thus I would expect that players would find an equilibrium in which they ran around enough shots that their forehand and backhand winning percentages end up closer together. Perhaps some ATPers overestimate the quality of their backhands, or maybe they don’t want to look foolish taking a chance in the doubles alley. Or they might just know what they’re doing, and the guy typing on his laptop should shut up about it.

Hunting Alcaraz

Sonego beat Dan Evans in Melbourne yesterday, earning him a date on Thursday with second-seeded Carlos Alcaraz. While there’s more to the match than Sonego’s hunt to maximize his 3F%, the battle for the Italian’s plus-one court position will play a big part.

Alcaraz is a bit better than the typical tour player at landing his returns in the server’s backhand corner, something he does 30.8% of the time, compared to the norm of 27.0%. But it doesn’t make him particularly effective at avoiding his opponents’ plus-one forehand. They find the preferred shot 64.5% of the time, almost exactly tour average. The story is the same when we look at first and second serves separately: Carlitos neither prevents nor encourages plus-one forehands.

There are, naturally, returners who consistently limit plus-one options; others don’t have the skills to avert a barrage of forehands. Jenson Brooksby allows opponents plus-one forehands on just 57.7% of his returns; Andy Murray and (surprisingly?) Rublev keep opponents’ numbers down around 59%. At the other extreme, Cam Norrie allows servers to hit plus-one forehands almost three-quarters of the time. He’s one of many lefties who struggle by this metric: Since serve returns are disproportionately backhands themselves, left-handers must often go down the line to put a return in a right-hander’s backhand corner. Norrie finds that corner only one-fifth of the time.

Well-targeted returns are good; forcing servers to hit plus-one backhands pays dividends. Alcaraz, though, is proof that you can make your money on the fourth shot and beyond. Opponents hit plenty of plus-one forehands against him, yet no matter what they choose for the second shot, they struggle to win the point. First serves, second serves, plus-one forehands, plus-one backhands … Carlitos beats tour average by multiple percentage points in every category. This table shows the difference between how players fare against Alcaraz and the average level, in percentage points:

VS CARLOS  rel FH W%  rel BH W%    
1st serve      -6.9%      -2.5%  
2nd serve      -2.2%      -5.0% 
Total          -5.7%      -3.5%

In other words, a plus-one forehand is 5.7 percentage points less likely to turn out well against Alcaraz than it is against an average ATP player. That’s a hefty margin for something that accounts for nearly half of the typical player’s service points.

It’s fun to know that Sonego occupies the unique position that he does on tour, and it’s entertaining to see some of the far-fetched places from which he’ll smack an inside-out forehand. It might even be useful to see the Italian’s “Hunting” stat at the conclusion of tomorrow’s match.

Alas, “setting up the point” and “winning the point” are two different things. Sonego might hunt down enough forehands against Alcaraz to manage the first, but the second is a considerably bigger ask.

* * *

Subscribe to the blog to receive each new post by email:
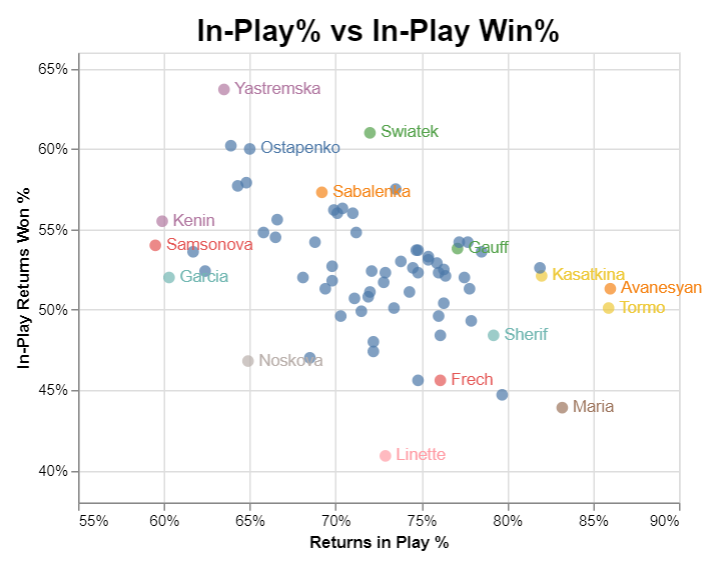
 

The Manufactured Attack of Caroline Garcia

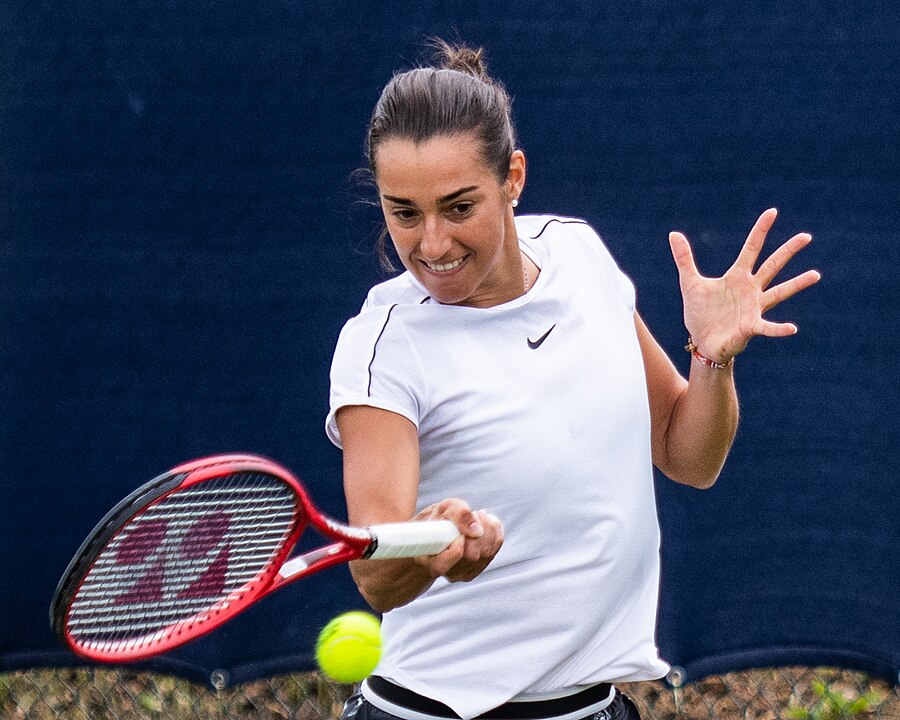
Caroline Garcia in 2019. Credit: Peter Menzel

Last night, Caroline Garcia scored what many fans saw as an upset, straight-setting two-time Australian Open champion Naomi Osaka. While Garcia was seeded 16th and Osaka is just beginning a comeback, no one ever knows quite what to expect when the Frenchwoman takes the court. The former champ, for her part, has always been at her best on big stages.

The result was almost pedestrian. Garcia turned in a performance that exemplified the tennis of her late 20s: Serving big, returning pugnaciously, taking risks, and–on the rare occasions that Osaka left her an opening–net rushing. Osaka served well, but the 16th seed out-aced her, 13 to 11. More than three-quarters of points were decided in three shots or less, and Garcia stole a few more of those from her opponent than Osaka did from her. In a contest defined by small margins–one break of serve and a tiebreak–that was all it took.

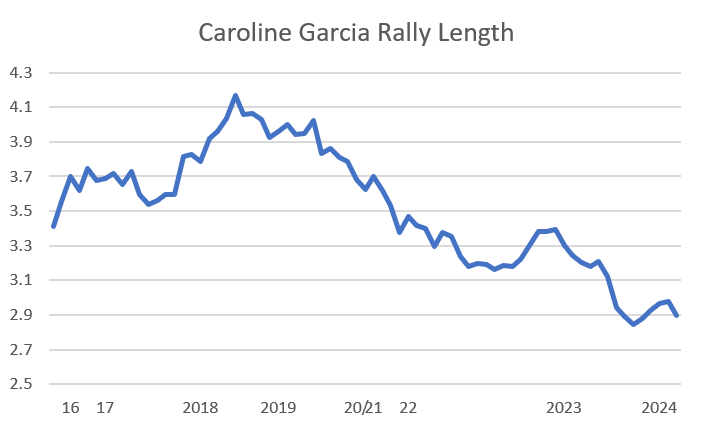
The strange thing is, Caro didn’t use to play like this. She plays shorter points than any other tour regular, an average of 2.9 shots per point in charted matches from the last 52 weeks. It isn’t just about her powerful first serve: Her return points end even sooner than her serve points do. Back in 2018, when she first reached her career-best ranking of 4th on the WTA computer, she was averaging over four shots per point, a rally length that would put her in the range of Jessica Pegula and Maria Sakkari: in other words, a very different sort of player.

Here is the evolution of Garcia’s rally length, shown as a rolling 10-match average, for the 84 matches in the charting dataset:

Last night’s rally length was a blink-and-you’ll-miss-it 2.5 shots, the second-lowest figure I have on record for Garcia. Only a match against Donna Vekic last year comes in slightly lower, though last week’s match in Adelaide against Jelena Ostapenko may have been even more extreme. Osaka’s big game helped keep the number down, but it takes two to so comprehensively avoid the long-rally tango.

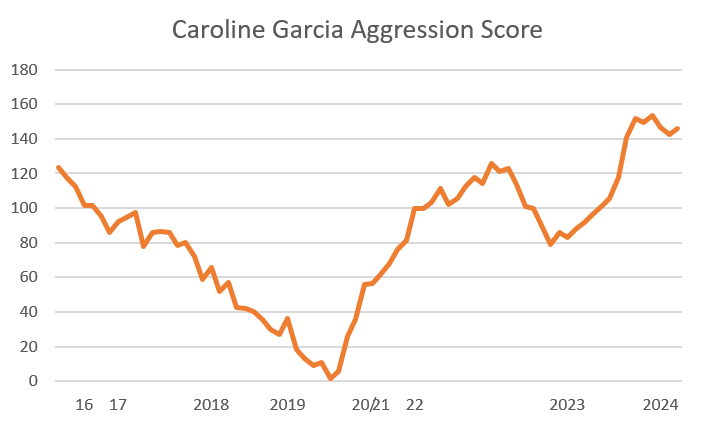
Garcia’s first serve has always been a weapon. But her tactical approach behind it has fluctuated wildly. The career trend of her Aggression Score in rallies illustrates how she has careened from one extreme to another. Aggression Score is scaled so that the most passive players rate around -100 and the most aggressive around 100, though Ostapenko and others have pushed the maximum figures further into triple digits. Here is how Garcia’s score has changed over time, again as rolling ten-match averages:

I don’t think there any other player in tennis–man or woman, past or present–who has followed a path like this. As she established herself as an elite on tour, even as she rose into the top five, she became more and more conservative. For reference, players who posted scores around zero in 2023 were Sakkari and Martina Trevisan, hardly styles that will remind you of Garcia’s. Eventually she reversed course, not only regaining her former style but surpassing it, ranking among Liudmila Samsonova and Aryna Sabalenka as one of the most aggressive players on tour, a rung below the class-of-her-own Ostapenko.

Is it working?

The oddest thing about the multiple phases of Garcia’s career is that she has reached the No. 4 ranking with two different styles. In each of her first three charted matches after achieving the peak ranking in 2018, she posted negative rally aggression scores. In two matches against Sabalenka, she averaged 3.9 and 3.7 shots per point; against Karolina Pliskova in the Tianjin final, the typical point lasted 4.3 strokes. When she returned to the No. 4 ranking at the end of 2022, after years in the wilderness, she was frequently posting triple-digit aggression scores and average rally lengths below 3.

The main effect of Garcia’s current style is that it makes the most of her serve. From 2015 to 2017, she won just over 66% of her first-serve points, a mark that is good but sub-elite. She fell all the way to 62% in 2021 before the big shift; since then, she has won more than 70% of her first-serve points. She ranked fourth in that stat heading into the Australian Open, and she converted nearly 90% of her first serves against Osaka. Her success behind the second serve hasn’t shown the same improvement, but the overall picture is a good one: She won more total serve points in 2023 than ever before.

The return game is a different story. This is where even a casual viewer can’t miss Caro’s new tactics: She’s not afraid to stand well inside the baseline to return serve, and yesterday she net-rushed one Osaka serve, SABR-style. Measured by court position, if not by winners and error stats, Garcia is even more aggressive than Ostapenko.

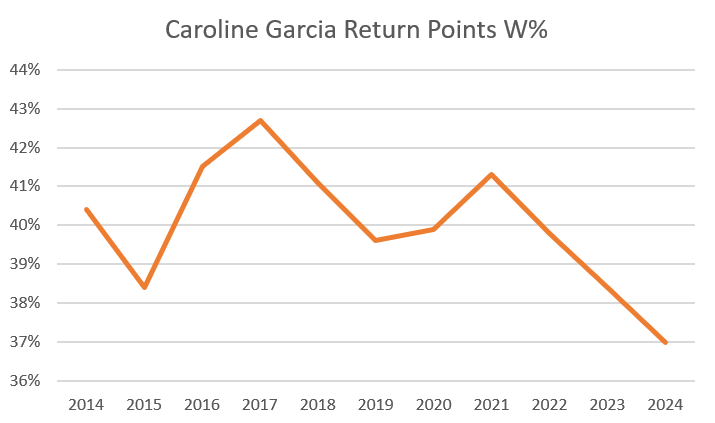
At her best, the Frenchwoman posted acceptable return numbers, if not great ones. Her best single-season mark, winning 42.7% of her return points in 2017, put her in the bottom third of top-50 players. As she has upped the intensity of her attack, this key number has headed south:

In the last 52 weeks, she has won just 38.3% of return points, worst among the top 50 by two full percentage points. Among the top 20, no one else is below 42%. She can get away with it because her own serve is so rarely broken, but such ineffectual return results will make it difficult to mount another assault on the top five. Breaking serve so rarely dooms her to a career of three-setters and narrow decisions. Those sorts of results can sometimes be encouraging–as in her pair of recent three-set losses to Iga Swiatek–but have a knack for halting winning streaks, too.

It doesn’t have to be this way. Players don’t sign contracts agreeing to deploy the same tactics on both sides of the ball. Garcia won return games far more often in her less aggressive days, breaking 33% of the time in 2017 compared to a dreadful 23% last year.

Some of Caro’s 2017 skills are still in evidence. She is solid enough in long rallies that she doesn’t need to so actively avoid them: In the last year, she has won a respectable 48% of points that lasted seven or more strokes, and if you remove the two Swiatek matches, she breaks even. While the Osaka match was primarily determined by short points, Garcia won 17 of 29 (59%) that went to a fourth shot.

Without any major changes, Garcia will remain the sort of player who aggravates fans and opponents alike, a dangerous lurker capable of delivering upsets, inexplicable marathons, and lame early exits in equal measure. Like any hyper-aggressive player, Caro’s results can be seemingly random, with all the frustration that entails. Unlike Ostapenko, Sabalenka, and the many ball-bashers on tour, though, Garcia has chosen to play this way, rebuilding her game into something that the 2018 version of herself would hardly recognize. If she can somehow join her late-career serve to her earlier return-game tactics, the randomness will disappear, and Caro may make yet another appearance in the top five.

* *

Subscribe to the blog to receive each new post by email:
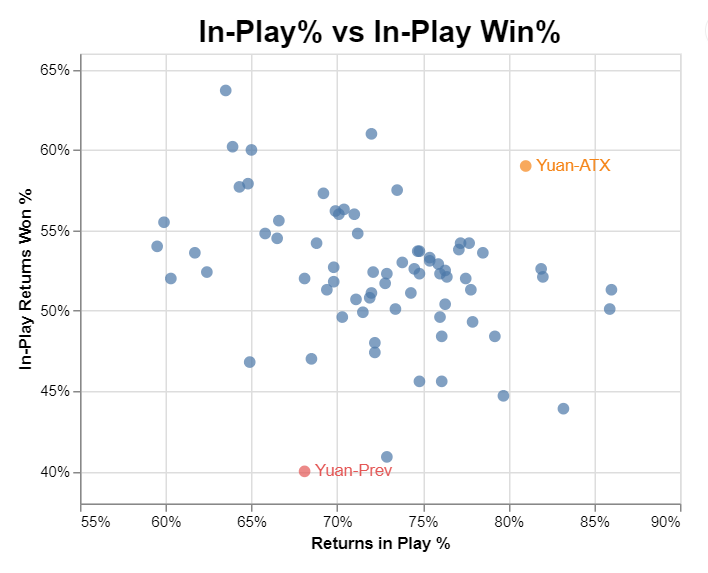
 

What Is Ben Shelton’s Ceiling?

Also today: First serve stats, and new Tennis Abstract reports.

Ben Shelton. Credit: 350z33

Ben Shelton is one of the rising stars of men’s tennis, the most exciting young player this side of Carlos Alcaraz. He possesses a monster serve, he’s not afraid to unleash old-school tactics, and he wears his heart on his sleeve. It’s impossible to root against this guy.

Shelton is also, by the standards of the game’s elite, not a very good returner.

Any discussion of his potential has to come to terms with this most obvious limitation. His rocket of a lefty serve will never hold him back; indeed, it’s already earned him places in the US Open semi-finals and the Australian Open quarters. You don’t have to do much dreaming to see him going even further and winning a major outright. What’s tougher to forecast is the sort of sustained performance that would take him to the top of the rankings.

Last year, Shelton won 32.6% of his return points at tour level. Average among the top 50 was 37.1%, and the top four players on the circuit (and Alex de Minaur) all topped 40%. Of the top 50, only Christopher Eubanks, at 30.9%, came in below Shelton.

There’s plenty of time for Ben to improve, and I’ll get to that in a moment. But first, let me show you the list of the year-end top-ten players with the lowest percentage of return points won (RPW%) since 1991, when the ATP began to keep these stats:

Player              Season  Rank   RPW%  
John Isner            2018    10  29.4%  
Kevin Anderson        2018     6  33.7%  
Milos Raonic          2014     8  33.8%  
Andy Roddick          2007     6  34.0%  
Hubert Hurkacz        2023     9  34.3%  
Greg Rusedski         1997     6  34.5%  
Matteo Berrettini     2019     8  34.6%  
Ivan Ljubicic         2005     9  34.6%  
Hubert Hurkacz        2022    10  34.7%  
Greg Rusedski         1998     9  34.7%  
Stefanos Tsitsipas    2023     6  34.7%  
Mark Philippoussis    2003     9  34.8%  
Andy Roddick          2010     8  34.9%  
Pete Sampras          1996     1  35.3%  
Jo Wilfried Tsonga    2009    10  35.3%  
Goran Ivanisevic      1995    10  35.4%  
Andy Roddick          2009     7  35.5%  
Pete Sampras          2000     3  35.5%  
Pete Sampras          2001    10  35.6%  
Andy Roddick          2008     8  35.6%

In 33 years, out of 330 top-ten finishes, only one man has reached the threshold with a RPW% lower than Shelton’s last year. And it’s someone you can’t exactly pattern a career after: If you look up “outlier” in the dictionary, you find John Isner’s face staring back at you.

Even more striking to me is that no one has finished in the top five with a RPW% below 35%. Then comes another outlier, Pete Sampras and his 1996 campaign. If your goal is to finish a season at number one, you’ll usually need a strong return. Sampras and Andy Roddick are the only two men who have topped the rankings with a RPW% below 38%. Otherwise, you’ve got to ask yourself one question: Are you Pete Sampras?

Here are the lowest RPW% numbers for top-three finishers since 1991:

Player           Season  Rank   RPW%  
Pete Sampras       1996     1  35.3%  
Pete Sampras       2000     3  35.5%  
Andy Roddick       2005     3  36.0%  
Milos Raonic       2016     3  36.1%  
Andy Roddick       2003     1  36.4%  
Casper Ruud        2022     3  36.9%  
Pete Sampras       1999     3  37.3%  
Andy Roddick       2004     2  37.5%  
Boris Becker       1994     3  37.6%  
Michael Stich      1993     2  37.9%  
Pete Sampras       1998     1  38.0%  
Marat Safin        2000     2  38.1%  
Grigor Dimitrov    2017     3  38.2%  
Patrick Rafter     1997     2  38.2%  
Roger Federer      2009     1  38.3%

(Did you expect to see Casper Ruud on this list? I did not.)

Shelton’s serve means that he could reach the top without the return-game success of Alcaraz or Novak Djokovic. But if he wants to move beyond the fringes of the top ten, this second table shows the range he needs to aim for. Setting aside the hot-and-cold tactics of Pistol Pete (we’ll come back to that, too), we can simplify things and say that a would-be world-beater needs to get his RPW% up around 36% or 37%.

How much can a return improve?

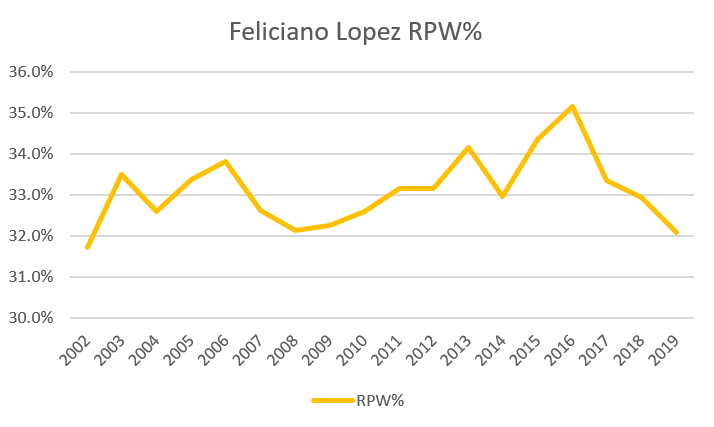
Bettering your core stats is possible, but not easy. Another lefty, Feliciano Lopez, offers a cautionary tale. In his age-20 season, he won 31.7% of return points, not far below Shelton’s mark. Here’s how his career developed:

Lopez didn’t top 34% for more than a decade, and he only reached 35% when he was 34 years old. In seven of his ten seasons between the ages of 21 and 30, his return was no more than 1.5 percentage points better than that first season.

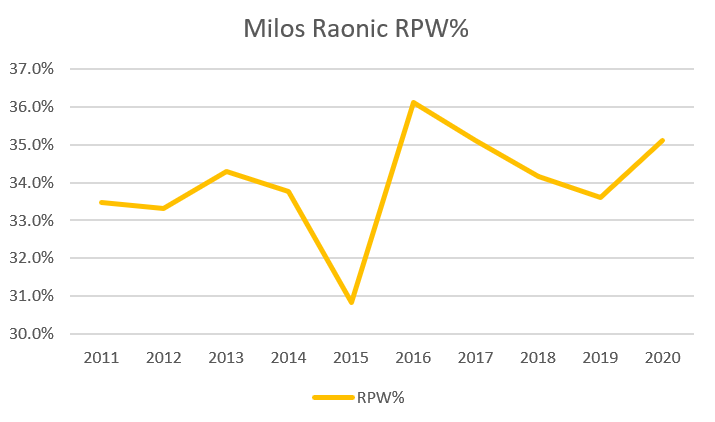
Here’s another one. Milos Raonic won 33.5% of his return points as a 20-year-old. He’s a better comp for Shelton, because Raonic’s serve was similarly effective as well. This graph shows how Raonic’s return evolved:

He barely improved on that 33.5% mark until 2016, when he peaked at number three in the ATP rankings, and he couldn’t sustain it. His career RPW% went into the books at 33.9%.

Many of you, I’m sure, are ready to object: Lopez was never the pure athlete that Shelton is! Raonic certainly wasn’t, and he played through one injury after another. Fair enough–if there are natural gifts that make it more likely that a player develops a tour-average return game after arriving on tour, Ben probably has them. Tough to argue with that.

Still, the numbers are brutal. There have been 99 players who racked up 20 or more tour-level matches in their age-20 season since 1991. 22 of them never improved–they never won return points at a higher rate than they did when they were 20. Of the lucky ones who managed to do better at some point in their careers, their peak was, on average, 1.7 percentage points higher than their age 20 number. For Shelton, that’s a peak RPW% of 34.3%, well below the targets established above.

Of that group of 99 20-year-olds, one out of ten improved (eventually) by at least ten percent–not percentage points–a gain that would move Shelton up to 35.9%, essentially the border of where he needs to be for a top-three finish. Let’s not understate the difficulty of the task. Players who reach tour level by age 20 are extremely promising, almost without exception, and Ben needs to put himself in the top tenth of that group.

It’s not obvious why boosting your return-game results is so difficult, or so rare. (It’s harder than improving serve stats, but that’s a topic for another day.) One factor is that as you climb the rankings, you face tougher opponents, so even if your game gets better, your stats appear to stagnate. The median rank of Shelton’s opponents last year was 54.5. The same number for Andrey Rublev is 40, and Daniil Medvedev’s was 27.

Another reason is that returning is a young man’s game. The skills that contribute to the service return–vision, reaction time, quickness, speed–peak early. I have no doubt that Lopez, Raonic, and just about everybody else on tour worked hard to get more out of their return over the years, but many of their gains simply cancelled out the losses they suffered from the aging process.

Beyond RPW%

Sampras was famous for tanking some return games, then going all-out late in the set. The energy-saving strategy was time-tested, going back another half-century to the “Big Game” theories of Jack Kramer and his mentor Cliff Roche. If you hold your serve (almost) every time you toe the line, you only need to break once–or win the tiebreak. Why waste the effort on every return point?

Shelton doesn’t go quite that far; he rarely looks apathetic on return. But he clearly gets energized when an opportunity presents itself, or when he decides it’s time to create one. If a player can consistently play better in big moments, his RPW% won’t tell the whole story. Nick Krygios did this on break points, though it wasn’t enough to get him into the top ten.

There’s some evidence that Shelton does as well. If he always played the same way–the level that earned him 32.6% of his return points–a simple model would predict that he would break serve 13.3% of the time. Instead, he broke 16% of the time, a rate that the model would have predicted for a returner winning 34.4% of points. Still not top-three territory, but getting closer.

Isner often overcame his return woes by securing more tiebreaks than his first-twelve-game performance would have suggested. He won more than 60% of his career breakers, coming close to a 70% mark in two separate seasons. Shelton might be using similar tactics, but he isn’t yet getting the same sort of results: He went a modest 18-16 in tiebreaks last season.

What about break points? This is one area where Sampras noticeably stepped up his game. From 1991 to 2000, he won 44 more break points than expected, based on his return-point stats on non-break points. It’s not a huge advantage–about one extra break of serve every 16 matches–but most players break even. This is one way in which Pete’s RPW% understated his effectiveness on return.

Here, Shelton really shines. My model suggests that he “should” have won break points at a 35.0% clip last year, since on average, players win break points more frequently than other return points. (Break points arise more often against weaker servers.) Incredibly, Ben won more than 41% of his break point chances. Instead of 96 breaks of serve, he earned 114. Since 1991, only a few dozen players have ever outperformed break point expectations by such a wide margin for a full season. Sampras never did, though he once got close.

If Shelton can sustain that level of break-point play, we might as well make room for him in the Hall of Fame right now. A modest improvement in RPW%, combined with reliably clutch performance in the big moments, would move him into the Sampras/Roddick range, where big servers can break serve just enough to catapult to the top of the rankings.

But… it’s a big if. Sampras averaged just four or five extra breaks per season, and he’s one of the all-time greats. In 2003, James Blake also exceeded break-point expectations by a margin of 18. The next year his score was negative 5. Across 2,600 pairs of player-seasons, there’s virtually no correlation between break point performance one year and the next. Shelton may defy the odds, just as Isner rewrote the book on tiebreak performance. But the smart money says that he won’t be so lucky this year.

Where does this leave us? If we’re optimistic about Shelton’s athleticism, commitment, and coaching team, there’s reason to expect that he’ll eventually win more return points–though probably not enough to reach the 36% threshold that usually marks off the top three. If he proves able to execute Kramer/Sampras/Kyrgios tactics under pressure, that might be enough to make up the difference. If he can do that, and he can remain as fearsome a server as he already appears to be, we might have a multi-slam winner, a top-three, maybe even number one player on our hands. The ceiling is high, but the ladder is steep.

* * *

First serve dominance

James Fawcette asks:

[At the United Cup] de Minaur lost only 1 point behind his first serve vs Djokovic, 33 of 34. Has anyone ever won every first serve point vs the then world number one in a completed match?

No!

Going back to 1991, when the ATP started keeping these stats, no one else lost only one, either. Here are the 18 matches in which a player lost three or fewer first-serve points against the world number one. In seven of the matches (noted with asterisks), all that big serving was for naught, and the favorite won anyway.

Tournament         Rd   Winner      Loser       Lost     
2024 United Cup    QF   de Minaur   Djokovic       1     
1992 Tour Finals   RR   Ivanisevic  Courier        2     
1993 Osaka         QF   Courier     Raoux          2  *  
1993 Tour Finals   RR   Sampras     Bruguera       2  *  
1996 Dusseldorf    RR   Kafelnikov  Sampras        2     
2000 Miami         SF   Kuerten     Agassi         2     
2002 Hamburg       QF   Safin       Hewitt         2     
2008 Indian Wells  SF   Fish        Federer        2     
2011 Tour Finals   RR   Ferrer      Djokovic       2     
1992 Paris         QF   Becker      Courier        3     
1992 Brussels      R16  Courier     Leconte        3  *  
1996 Tour Finals   SF   Sampras     Ivanisevic     3  *  
2000 Scottsdale    R16  Clavet      Agassi         3     
2002 Rome          R32  Moya        Hewitt         3     
2008 Halle         SF   Federer     Kiefer         3  *  
2008 Olympics      R64  Federer     Tursunov       3  *  
2010 Tour Finals   F    Federer     Nadal          3     
2018 Canada        R32  Nadal       Paire          3  *

* * *

New toys

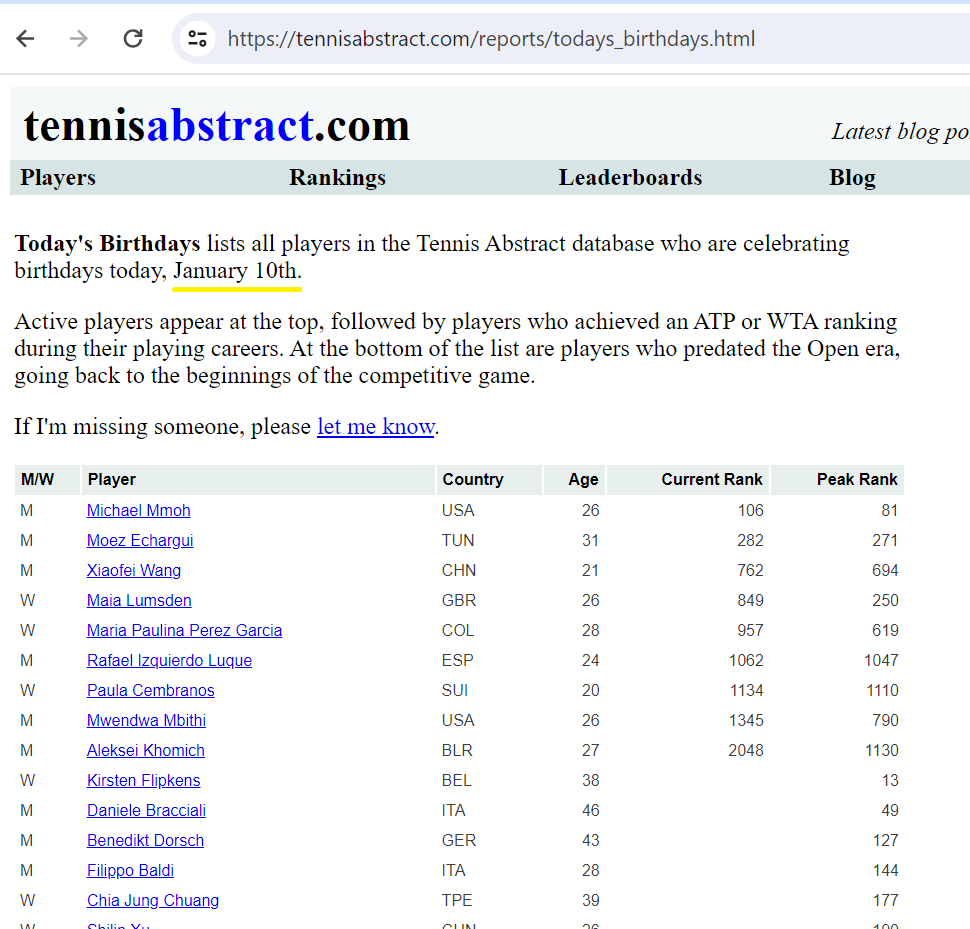
Yesterday I added two new features to Tennis Abstract. First, there’s a list of today’s birthdays:

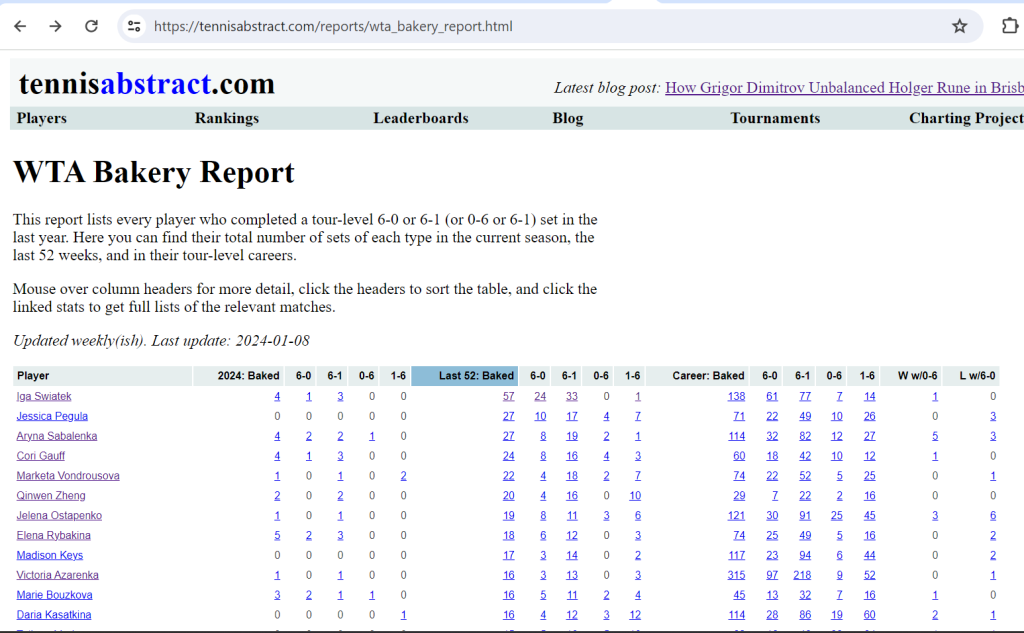
Second, there’s a “Bakery Report” (one each for men and women) with comprehensive stats on 6-0 and 6-1 sets won and lost:

The birthday list will update daily, and the bakery report will refresh every Monday, expect in the middle of grand slams.

Enjoy!

* * *

Subscribe to the blog to receive each new post by email:


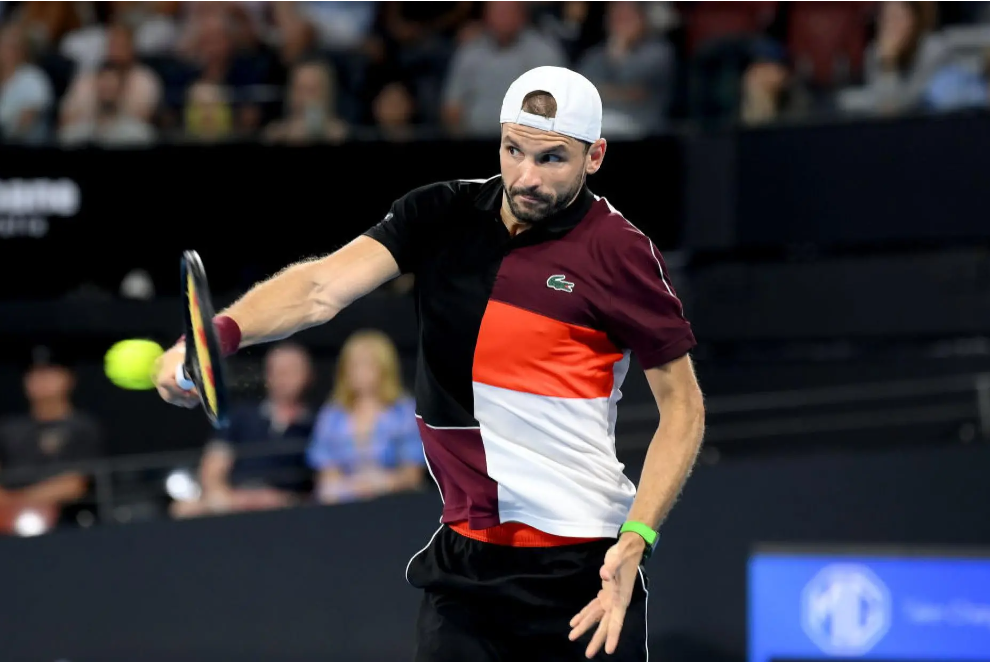
How Grigor Dimitrov Unbalanced Holger Rune in Brisbane

Grigor Dimitrov. Credit: Bradley Kanaris / Getty

Grigor Dimitrov was long known as “Baby Fed,” but yesterday, Holger Rune was the one trying to do a Roger Federer impression. Facing break point at 3-all in the second set, Rune kicked a second serve wide, got a cross-court slice reply, then ran around his backhand to smack an inside-in forehand: a high-risk, high-reward shot, especially if you aim for the line. Rune went big and he pulled it wide. That was the only break of the match.

The 20-year-old had already missed one of those in the same game: The first error dug him a 15-40 hole. Over the course of the match, he attempted seven inside-in forehands, a shot that usually wins him two out of three points. Against Dimitrov, he blew four of them.

The errors are a symptom of one of something separating Rune from the top of the game. In his eagerness to maintain an aggressive position at the baseline–a willingness that defines his style and, in fairness, often pays off–he tries a bit too hard. He swings to end points in three shots that probably need to go five. He keeps a toe on the baseline when he ought to be one step further back.

This isn’t a secret, and Dimitrov exploited it. The Bulgarian landed 82% of his returns behind the service line, compared to a tour average of 70%. 39% of Dimitrov’s returns fell in the back quarter of the court, beating the 28% that players typically face. In rallies, the veteran kept pummeling Rune’s feet, prioritizing depth over direction.

The strategy worked. Take the other pivotal juncture of the match, early in the first-set tiebreak. Serving at 0-1, Rune pushed Dimitrov off the court with an inside-out forehand, which came back as a deep slice. Nothing special, but as Rune stepped back to accommodate it, he hit an equally indifferent reply. Dimitrov came back with another middle-deep backhand and Rune hit the tape with as pedestrian an error as you’ll ever see. At 0-2, Rune’s plus-one forehand forced Dimitrov deep and set up the point for an easy finish–or so he thought. Dimitrov managed to get his defensive forehand deep enough that Rune stepped in–his back foot on the baseline–and the result was another miss that would leave a club player berating himself.

On both points, a slightly more conservative court position, or a better last-minute adjustment step, would have let Rune continue the rally with his opponent on the run. Most players tread more carefully in tiebreaks. Instead, he missed twice and fell to 0-3. He got one point back but couldn’t close the entire gap and lost the first set, 7-6(5).

Middle-deep mediocrity

Yesterday wasn’t the first time that Rune misreads a neutral opportunity as a chance to go big. His own-the-baseline strategy is a mixed bag, the best example of which is how he responds to service returns that land at his feet. The Match Charting Project codes every return by direction (cross-court, middle, or down-the-line) and by depth (shallow–in front of the service line, deep–behind it, or very deep–in the back quarter of the court). Dimitrov placed 13 of his returns in the middle-deep region, and Rune saved just 5 of those points.

When a return lands middle-deep, the point is fully up for grabs. Counting both first- and second-serve points, the server wins roughly 49% of the time from that position. (Once a deep return is in play, any lingering effect of a big serve is mostly erased.) A top player should do better, but Rune does not. Here are the career outcomes of those points for the current ATP top four, plus the two Brisbane finalists:

Player             W/FE%   UFE%  PtsWon%  
Novak Djokovic      6.8%   7.1%    53.8%  
Jannik Sinner       5.7%   6.0%    51.6%  
Daniil Medvedev     5.3%   5.9%    50.6%  
Carlos Alcaraz      8.0%   6.2%    50.1%  
Grigor Dimitrov     9.6%   7.9%    49.6%  
--Average--         7.4%   8.7%    48.9%  
Holger Rune        11.5%  10.9%    48.0% 

Rune is much more aggressive than his peers in these situations. It may feel like it pays off, since he ends more points with winners (or forced errors) than unforced errors. But the bottom line tells another story: He wins fewer points than average, and trails the best players in the game by a sizeable margin. As Djokovic, Sinner, and Medvedev can tell you, from a neutral position, immediate outcomes don’t matter as much as point construction.

It’s the same story later in the rally. Dimitrov won those two crucial tiebreak points by putting his second shot near the baseline. The serve return isn’t unique: Any stroke that lands in the middle-deep region turns the point into a 50-50 proposition. The above table showed how players fare from that position on the plus-one shot. Here are the numbers for everything after that:

Player           Winner%   UFE%  PtsWon%  
Carlos Alcaraz      8.2%  12.8%    55.3%  
Grigor Dimitrov     6.6%   6.3%    54.7%  
Novak Djokovic      6.2%   8.0%    54.6%  
Jannik Sinner       7.2%  10.5%    52.3%  
Daniil Medvedev     4.7%   6.8%    52.0%  
--Average--         7.1%  10.2%    49.3%  
Holger Rune         9.4%   9.7%    49.0%

The order changes, and Rune’s aggression doesn’t stand out like it does earlier in the rally. But the message is the same, only with a wider margin. Given the mix of players represented in the Match Charting Project, “average” is better than tour average, but it’s still a number Rune needs to surpass.

The second table, finally, brings us back to Dimitrov. If he hadn’t played yesterday, I wouldn’t have thought to include him on the list with the top four, but in this type of situation–one that demands both patience and tactical soundness–he rates with the best in the game.

Faced with an over-aggressive, slightly erratic opponent, the 32-year-old took advantage and turned in a workmanlike performance. That isn’t a dig: Dimitrov didn’t need fireworks, just steadiness. By my count, he racked up just 10 unforced errors to Rune’s 29, and just one of them–serving for 4-0 in the tiebreak–came a critical moment. It’s nothing so flashy as the “Baby Fed” moniker once promised, but Dimitrov’s mature game has gotten him up to 7th place on the Elo list, and a return to the official top ten is not far away.

* * *

Subscribe to the blog to receive each new post by email:
 

The Most Exclusive Clubs In Tennis

The new Big Two?

Tireless podcaster Alex Gruskin likes to talk about what he calls the “top-ten, top-15, top-20, and top-25 clubs.” He works out the membership of each one by consulting the Tennis Abstract ATP and WTA stats leaderboards, which display dozens of metrics for each of the top 50 ranked players on both tours.

To qualify for Alex’s “top ten club,” a player needs to be in the top ten in both hold percentage and break percentage–in other words, to be an elite server and returner. Even cracking the top 25 club is no easy task. In 2023, only 11 men were better than half of the top 50 on both sides of the ball. It’s more common to excel at one or the other. In 2022, the best returner (Diego Schwartzman) ranked 50th out of 50 on serve, and the best server (Nick Kyrgios) came in 40th on return.

The top-25 club is a high standard, and the top-ten club is a stratospheric one. This year, only three men–Novak Djokovic, Jannik Sinner, and Carlos Alcaraz–made the cut, and Alcaraz almost missed it, ranking 10th in hold percentage. Daniil Medvedev almost qualified, but he trailed Alcaraz by 0.7% in hold percentage and came in 11th in that category.

Three top-ten clubbers is, as it turns out, an unusual showing. In the 33 seasons for which we have the necessary stats to calculate hold and break percentage (back to 1991), only 13 men have ever managed the feat. Many of them did it several times, so there are a total of 49 player-seasons that qualify. For the two-plus decades between 1991 and 2011, there were only two seasons in which more than one player reached both top-ten thresholds. In 1992, the entire tour fell short.

By “club” standards (and most others), Djokovic’s 2023 season was particularly impressive. Alex usually classifies players into round-number clubs, occasionally giving credit to a near-miss who makes, for instance, the “top 26” club. We can extend the concept a bit further and place every season into its best possible club: If a player ranks in the top three by both hold and break percentage, he’s in the “top-three” club; if he ranks among the top four in both, he’s in the “top-four club,” and so on.

In 2023, Novak led the tour in hold percentage and was bested by only Alcaraz and Medvedev in break percentage. Thus, he’s a member of the top-three club. More exclusive categories are hard to find. Here’s the complete list of top-three clubbers since 1991, along with their ranks in hold percentage (H% Rk) and break percentage (B% Rk):

Year  Player          H% Rk  B% Rk  CLUB  
2023  Novak Djokovic      1      3     3  
1999  Andre Agassi        3      1     3  
1995  Andre Agassi        3      3     3  

That’s it.

Sinner’s 2023 campaign was also sneakily great. He finished a deceptive fourth on the official ATP points table, but by ranking fifth in hold percentage and fourth in break percentage, he joined an absurdly elite group of top-five clubbers: only Djokovic, Agassi, Rafael Nadal, and Roger Federer.

Here’s the full list of top-ten club seasons since 1991:

Year  Player            H% Rk  B% Rk  CLUB  
2023  Novak Djokovic        1      3     3  
1999  Andre Agassi          3      1     3  
1995  Andre Agassi          3      3     3  
2021  Novak Djokovic        4      3     4  
2013  Rafael Nadal          4      1     4  
2008  Rafael Nadal          4      1     4  
2002  Andre Agassi          4      3     4  
2023  Jannik Sinner         5      4     5  
2019  Rafael Nadal          5      1     5  
2017  Rafael Nadal          5      2     5  
2015  Novak Djokovic        5      1     5  
2014  Novak Djokovic        5      2     5  
2012  Rafael Nadal          5      1     5  
2007  Rafael Nadal          5      2     5  
2006  Roger Federer         2      5     5  
2003  Andre Agassi          5      3     5  
                                            
Year  Player            H% Rk  B% Rk  CLUB  
2022  Novak Djokovic        6      4     6  
2013  Novak Djokovic        6      2     6  
2021  Daniil Medvedev       7      4     7  
2020  Rafael Nadal          7      2     7  
2019  Novak Djokovic        7      2     7  
2012  Novak Djokovic        7      2     7  
2011  Novak Djokovic        7      1     7  
2010  Rafael Nadal          2      7     7  
2008  Novak Djokovic        7      4     7  
2004  Roger Federer         2      7     7  
2021  Alexander Zverev      8      7     8  
2020  Daniil Medvedev       8      8     8  
2018  Novak Djokovic        8      5     8  
2016  Novak Djokovic        8      2     8  
2015  Roger Federer         4      8     8  
2005  Roger Federer         2      8     8  
2001  Andre Agassi          8      3     8  
1998  Marcelo Rios          8      2     8  
1991  Stefan Edberg         4      8     8  
                                            
Year  Player            H% Rk  B% Rk  CLUB  
2022  Daniil Medvedev       8      9     9  
2020  Andrey Rublev         9      5     9  
2018  Rafael Nadal          9      1     9  
2017  Roger Federer         2      9     9  
2009  Andy Murray           9      2     9  
2007  Roger Federer         3      9     9  
2000  Andre Agassi          8      9     9  
2023  Carlos Alcaraz       10      1    10  
2020  Novak Djokovic       10      4    10  
2019  Roger Federer         3     10    10  
2013  Roger Federer         7     10    10  
1998  Andre Agassi         10      3    10  
1994  Andre Agassi         10      5    10  
1993  Thomas Muster        10      4    10

The list is heavily weighted toward the Big Three and the current era. Whether it’s surface speed convergence or something about the players themselves, it’s tougher to reach the top with a lopsided game these days. Stefan Edberg was a top-eight clubber in 1991 (and might have been as good for several seasons before that), but Pete Sampras didn’t get anywhere close. His best showing by this metric came in 1997, when he cracked the top-14 club. Andy Roddick never even cleared the top 30.

Finally, here are the 15 men who reached both top-30 thresholds in 2023:

Year  Player            H% Rk  B% Rk  CLUB  
2023  Novak Djokovic        1      3     3  
2023  Jannik Sinner         5      4     5  
2023  Carlos Alcaraz       10      1    10  
2023  Daniil Medvedev      11      2    11  
2023  Andrey Rublev        17     11    17  
2023  Karen Khachanov      18     16    18  
2023  Alexander Zverev     15     18    18  
2023  Grigor Dimitrov      19     15    19  
2023  Taylor Fritz          6     19    19  
2023  Casper Ruud          21     17    21  
2023  Holger Rune          20     21    21  
2023  Frances Tiafoe        9     26    26  
2023  Ugo Humbert          29     23    29  
2023  Roman Safiullin      30     24    30  
2023  Sebastian Korda      14     30    30

Women’s clubs

The WTA gets the short shrift on topics like these, because much less historical data is available. I only have the necessary stats back to 2015, and even that season is incomplete.

Still, that doesn’t make some recent individual performances any less impressive. Iga Swiatek’s effort in 2023 predictably stands out: She came in third behind Aryna Sabalenka and Caroline Garcia in hold percentage, and she trailed only Sara Sorribes Tormo and Lesia Tsurenko in break percentage. By finishing third in both categories, she–like Djokovic–is a member of the top-three club.

Depending on how you define a full-season, Iga might be the first ever woman to reach such a standard, at least in the nine-year span for which we can do the math. Here is the full list of top-ten clubbers back to 2015:

Year  Player             H% Rk  B% Rk  CLUB  
2016  Victoria Azarenka      2      1     2  
2023  Iga Swiatek            3      3     3  
2022  Iga Swiatek            5      1     5  
2019  Serena Williams        1      6     6  
2015  Serena Williams        1      7     7  
2016  Serena Williams        1      8     8  
2016  Angelique Kerber      10      6    10 

Azarenka’s run in 2016 was really a partial season: She hurt her knee and didn’t play again after retiring from her first-round match at the French. Her first four months of tennis put her on the path toward a historic campaign, but we’ll never know how it would have turned out. Those 29 matches can’t really be set along the same measuring stick as Iga’s 75-plus in each of the last two years. Serena’s three entries on this table were almost as abbreviated, but again we’re reminded of the limited data. Surely the list would be much longer, with many more instances of the Williams name, if we had better data.

Anyway, all hail the great Iga. May her reign last until Sabalenka figures out how to become a top-ten returner.

At least this year, it was slightly harder to crack the top-25 and top-30 clubs in the women’s game than it was in the men’s. Here is the full 2023 women’s list down to the top-32 threshold, which allows us to include a few names of interest who missed out on the top 30:

Year  Player               H% Rk  B% Rk  CLUB  
2023  Iga Swiatek              3      3     3  
2023  Cori Gauff              13      8    13  
2023  Jessica Pegula          16      5    16  
2023  Madison Keys             6     16    16  
2023  Barbora Krejcikova      12     18    18  
2023  Victoria Azarenka       19     17    19  
2023  Aryna Sabalenka          1     20    20  
2023  Marketa Vondrousova     22      6    22  
2023  Karolina Muchova         8     22    22  
2023  Leylah Fernandez        20     27    27  
2023  Jelena Ostapenko        28     12    28  
2023  Marie Bouzkova          29     21    29  
2023  Caroline Dolehide       23     30    30  
2023  Elina Svitolina         31     24    31  
2023  Beatriz Haddad Maia     18     31    31  
2023  Ons Jabeur              32      9    32  
2023  Belinda Bencic           5     32    32

More than ever, a well-rounded game is a necessity for players who hope to reach the top. For fans, “clubs” like these are a useful way to think about which stars are getting the job done on both sides of the ball.

* * *

I’ll be writing more about analytics and present-day tennis in 2024. Subscribe to the blog to receive each new post by email:
 

Alexander Bublik and Return of Serve Futility

In Sunday’s Singapore final, Alexander Bublik won six return points. Not a typo. Out of Alexei Popyrin’s 52 serve points, that’s a win percentage of 11.6%. The technical term for this level of performance is… bad.

Yet somehow, Bublik concentrated four of those points in the fifth game and broke serve. (Popyrin helped–one of the four was a double fault.) Even more miraculously, it was the only break in the opening set, so the Russian won the set and got halfway to the title. Alas, he cranked the futility up another notch, winning only one return point the rest of the way, and it was Popyrin who came away with his maiden championship.

Freakish statistical feats tend to raise three questions: What are the odds? Has this ever happened before? And, can we learn anything from this nonsense?

What are the odds?

If Bublik had that exact 11.6% chance of winning each service point, his probability of breaking in any given game would be 0.26%, or about 1 in 384. In reality, it’s probably higher than that, because servers aren’t robots. Presumably Popyrin’s level dipped a bit. Still, if we take that 0.26% as the answer, Bublik’s likelihood of breaking serve at least once in the 22-game match were less than 3%.

You probably don’t need the precise numbers to recognize that, if you win six return points in the whole match, your odds of breaking serve aren’t that great.

Has this ever happened before?

The answer depends on what you mean by “this.” In our 30 years of ATP tour matches with stats on things like return points won and breaks of serve, the Singapore final was the first time that a player broke serve and won a set despite winning six or fewer return points.

It’s fairly common for a player to have a very bad return day, or face an extremely hot server. On average, there are about 30 completed tour-level matches per year in which the loser manages six or fewer return points. But of those 900-plus matches, the official stats only show seven times that the loser managed to break serve. (I emphasize “official” here because the ATP’s stats do have errors, and extreme situations like these tend to bring them out of hiding. A simple data-entry error can easily make a routine match look like a record-breaker.)

The most recent instance of six-return-points-and-a-break was in 2010, when Lukasz Kubot concentrated his efforts in a single return game of a Bucharest first-round match against Filippo Volandri. Every match on the list was a first-rounder except for a 1995 quarter-final at the Tokyo Indoors, when Alexander Volkov managed to break Michael Chang despite winning only those few return points.

Every six-pointer was a straight set loss, at least until Bublik came along.

Except… it’s possible to win six or fewer return points and win a set without breaking serve. In fact, it’s theoretically possible to win an entire match with only two return points going your way, if you deploy them in tiebreaks and remain flawless on your own deal. Reilly Opelka did exactly that (well, he won six points, not two) in Basel two years ago against Cristian Garin. Garin won all but 6 of his 69 service points but lost, 7-6(5) 7-6(10).

Bublik’s feat in the Singapore final wasn’t quite that level of oddity, but as an accomplishment amid return futility, his break-and-a-set is a close second.

Can we learn anything from this nonsense?

Bublik is a talented player, but he’s not a very good returner. This was his third career ATP final (excluding a two-game retirement in January), and his rates of return points won in those matches are 26.7%, 18.9%, and now 11.6%. It’s no surprise that he’s still looking for his first title. It turns out that underarm serving doesn’t have any secret advantages for his return game.

He has won 35.6% of his return points over the last 52 weeks–an improvement over his 34.1% mark at tour level in 2019, but still only good for 42nd out of the current ATP top 50. If he continues to serve big, that’s good enough for an Isner-like career, possibly spending considerable time in the top 20, maybe even with a brief stop in the top ten.

But to reach the next level, the Russian will need to return a lot better. Several years ago, I looked at the “minimum viable return game” necessary for an elite player. At the time, I was interested in Nick Kyrgios’s chances at a spot near the top of the rankings despite his own brand of return futility. In the 25 years between 1991 and 2015, when I wrote that piece, only four players finished a season in the top five while winning less than 37% of their return points, and two of those were within a percentage point of the threshold.

Kyrgios wasn’t close to that level then, and he still isn’t. Bublik is closer, but he’s still on the wrong side of the line. Optimists can point to the Russian’s relative youth–he turns 24 in June–and trust he’ll improve. Of course he might, but history isn’t on his side there, either. Kyrgios’s lack of progress is typical of the breed. Mediocre returners may improve their skills and tactics, but as they do so, they face more difficult opponents, keeping their numbers down.

If there is a positive take-away from the Singapore final, it’s that Bublik did manage to bunch his return points. Kyrgios outplays his numbers by saving his heroics for bigger moments. (Another way of looking at “outplaying his numbers” is “underperforming given his skills.”) Bublik shows signs of doing the same, so when he does manage to win more than six return points, he may be able to eke disproportionate gains out of them.

That’s the theory, anyway.

Charting Aryna Sabalenka’s Win Streak

Aryna Sabalenka has won 3 titles and 14 matches in a row. Let’s dig into the data and see if we can identify any improvements that would account for her success.

For the Match Charting Project, I’ve logged every shot of each of the Belarussian’s tour-level matches. (There are a few exceptions where I haven’t found video.) We’ll look at hard-court matches only today. With that constraint, we have 140 Sabalenka matches, dating back to early 2017 (including the current streak), and another 1,121 women’s tour-level contests over the same time period for reference.

Big serving?

Aryna always brings a powerful serve, but it remains a work in progress, at least tactically. The key metric for pure serve dominance is unreturned serves–quite simply, serves that don’t come back. While some are aces, they don’t have to be, and the distinction doesn’t really matter.

This first graph has a lot going on, but as I’ll use the same basic template for several more figures, it’s worth taking a moment to understand what we’re looking at. The two dotted lines show tour average rates of unreturned serves (the lower average is for all players; the higher one is for match winners), the thin jagged line shows Sabalenka’s rate of unreturned serves for each individual match, and the thicker red line shows her five-match rolling average.

Her five-match rolling average has been above 30% for the entire win streak. It’s not an unprecedented level for her, though–she sustained similarly high levels at various points over the last three years. (We should also be a bit cautious ascribing serve effectiveness to a player when the Ostrava, Linz, and Abu Dhabi courts might have been faster than average.) Consistently powerful serving has certainly helped Sabalenka’s cause, but it probably isn’t the whole story.

We might gain from breaking down Aryna’s serve effectiveness into first and second serves. First, let’s look at something else:

Serve plus one

There are two ways we could look at “serve plus one” effectiveness, and we’ll do both. First, let’s count Sabalenka’s opportunities to hit a second shot behind her serve, and see what percentage she puts away. (As with aces and other unreturned serves, the “winner” concept is a distraction: I’m counting second-shot winners together with shots that force errors. If you end the point, it doesn’t matter much whether your opponent touches the ball.)

The second figure shows us that, on hard courts, when women are faced with a second shot behind their serve, they finish the point about 20% of the time. Sabalenka’s career average is 28%. She far exceeded that over a string of four matches to finish Ostrava and start Linz, maxing out at 42% against Jennifer Brady in the Ostrava semi-final. Since then, her rate returned to roughly her (impressive) career average.

This measure is something of a “key to the match” for Sabalenka. When she converts at least 30% of second-shot opportunities behind her serve, she wins 91% of her matches. When she doesn’t, she wins 62%. Of course, 62% is nothing to be ashamed of, and the dip visible in early 2020 coincides with her Doha title, the one time in her career that the five-match rolling average fell below 20%.

Serve plus serve plus one

These first two measures are related, of course. A big server should post good numbers in both. But a great “pure” serving day might mean a worse-looking serve-plus-one day, because fewer weak returns are coming back at all. The reverse holds as well: A strong server might not hit as many unreturned serves as usual because her opponent is managing to just barely put them back in play–easy sitters for second shots.

To identify the combined benefits of good serving and efficient serve-plus-one’ing, we simply count how often Sabalenka wins service points in two shots or less.

We’ve already seen the two components of this, so there are no surprises here. The typical player wins about 40% of her service points this way, and Aryna has historically averaged 46% on hard courts. This number looks as good for her recent winning streak as we’d expect. But as with the previous graph, it suggests weakness during her 2020 Doha title, so the predictive power here is limited.

First and second serves

The combined metric of unreturned serves plus second-shot putaways gives us a good snapshot of when the offensive game is working. Let’s break down the previous graph into first- and second-serve specific numbers:

These track the overall numbers. Aryna has generally been good lately on both first and second serves, but with neither one has she been more successful or consistent than in previous hot streaks. Second serves are particularly hard to rate because the per-match sample size is so small–fewer than 30 second serve points per player per match, and some of those end up as double faults.

Before moving on to the return game, let’s look at one more indicator of service-point success:

Longer points on serve

As I said at the outset, Sabalenka has always been a good server. While her current momentum might owe a bit to fewer mental lapses on serve, it would be logical to look elsewhere for an explanation, simply because there was more room to improve in other areas.

We’ve seen how her serve and second shot rate. What about serve points that go deeper? This metric considers all points where the returner’s second shot comes back, and then counts how often the server goes on to win the point.

The average hard-court WTA match winner claims almost exactly half of her service points when the rally reaches five shots. Over her career, Sabalenka has won 48%, worse than the typical match winner but better than the overall tour average.

Aryna has done better lately. To cherry-pick a starting point, she has won 51% of these points in her last 24 matches, dating back to the Doha second round. Her average over the first five matches in Abu Dhabi was 55%, the best she has managed since her breakout run in late 2018, when she pushed Naomi Osaka to three sets at the US Open and hoisted the Wuhan trophy a few weeks later.

Return winners

We’ll walk through the dimensions of her return performance in a similar manner, starting with return winners (and point-ending non-winners), then on to “return-plus-one” putaways, followed by the combination of the two.

First, return winners. I use the number of point-ending return winners divided by in-play serves–that is, excluding double faults.

Veronika Kudermetova had a rough day last Wednesday, so Sabalenka’s current five-match rolling average is as high as it’s been since early 2018. Apart from that last-minute burst of return dominance, her recent return winner rates look a bit like the serve stats: consistently solid, if not spectacular.

Return plus one

How about when the serve return doesn’t finish the job? This “return plus one” metric counts opportunities when the server puts her second shot in play and measures how often the returner hits a winner or forces an error with her own second shot. The sample sizes are a getting a bit small here (each player has 43 such opportunities in an average hard-court match), so the per-match rates are rather spiky:

The small single-match samples, combined with the relationship between return-plus-one and return winners–almost interchangeable ways to respond successfully to a mediocre serve–render conclusions a bit tough to come by. Sabalenka was average by this measure in Ostrava, great in Linz, and all over the place in Abu Dhabi.

Short return points won

Will things be clearer when we combine both methods of quickly winning a return point?

Aside from a weak return performance against Elena Rybakina in Abu Dhabi, Sabalenka has been comfortably above average in this metric in every match since she faced Victoria Azarenka in the Ostrava final.

Like “serve plus one,” this is a good indicator of overall success for the Belarussian. If we use this metric to split her 140 charted hard-court matches in half, the dividing line is 27.5% of return points won with a return winner or a return-plus-one putaway. Above that mark, she has won 62 matches, or 88.6%. Below it, she has won only 41, or 58.6%. She was above the line in nearly all of her matches in Linz and Abu Dhabi, and she sat at 25% or higher in every round of her 2020 Doha triumph, clearing 30% in three of five matches there.

First and second serve returns

Has she been particularly devastating against first or second serves? Let’s see:

Few women feast on second serves the way Sabalenka does, and she’s been particularly relentless of late. The typical tour player wins about 30% of second-serve return points with a first- or second-shot putaway, and over her last 15 matches, Aryna has won 41% that way. 41% is a respectable total percentage of return points won against many servers, and Sablaenka would be winning that many even if she refused to hit more than two shots per rally.

Granted, Sabalenka doesn’t hit that many fifth or sixth shots. How does she fare when her return points extend that far?

Long return points

You’ll be glad to know that the code for this final* graph didn’t throw any divide-by-zero errors–Aryna has played at least one “long” return point in each of her hard-court matches. This metric tallies up all return points in which the server puts her third shot in play, then calculates how often the returner won the point.

** Yes! It’ll be over soon!

This is another spiky mess, with an average of only 20 points per match. Still, if we’re looking for a category in which Sabalenka is newly excelling–not just thriving as usual–this could be our smoking gun.

Tour average for match winners on this stat is 46.7%. The server has an advantage by definition, because she has just put the ball back in play. The Belarussian’s career mark is 44.4%, only a bit better than the overall average. Yet in her last 15 matches, she has won 48.0% of these long return points, her best 15-match span since early in her career, when she faced a weaker mix of opponents.

I don’t want to overemphasize this: When there are only 20 points of this type per match, an improvement of 3.6 percentage points translates to a gain of less than one point per match. That doesn’t explain the magnitude of Sabalenka’s recent gains. But it does indicate that she is shoring up one of her few weaknesses, and in combination with her solid play on long serve points, it suggests that she no longer needs to rely on a one-two punch, even if her one-two punch is as dizzying as anyone’s.

Don’t make me say consistency

Tennis matches are decided by a handful of points: While Sabalenka has been dominant lately, she lost more points than she won against Coco Gauff in the Ostrava opening round. As such, improvements always look minor when we try to quantify them, if we can quantify them at all.

I’ve pointed out some areas where Sabalenka may be improving, others where a good statistical showing usually coincides with a W, and still others where an excellent performance doesn’t seem to matter much. All of these categories have one thing in common: She is putting up stellar numbers right now.

Remember, in the twelve graphs above (yes, twelve, sheesh), the dotted yellow lines indicate the average performance of match winners. In every single one of the categories, Aryna’s five-match rolling average is above that line. Every single one! In most cases, it has been above the line for some time.

It doesn’t take any statistical savvy to see that if a player is better than the average match winner in every category, she’ll be awfully tough to beat. The rest of the Australian Open field can only cross their fingers that Sabalenka’s current form won’t survive two weeks of quarantine.

Match Charting Project Return Stats: Glossary

I’m in the process of rolling out more stats based on Match Charting Project data across Tennis Abstract. This is one of several glossaries intended to explain those stats and point interested visitors to further reading.

At the moment, the following return stats can be seen at a variety of leaderboards.

  • RiP% – Return in play percentage. The percent of return points in which this player got the serve back in play.
  • RiP W% – Return in play winning percentage. Of points in which the returner got the serve back in play, the percentage that the returner won.
  • RetWnr% – Return winner percentage. The percentage of return points in which the return was a winner (or induced a forced error).
  • Wnr FH% – Return winner forehand percentage. Of return winners, the percentage that were forehands (topspin, chip/slice, or dropshot).
  • RDI – Return Depth Index, a stat recently introduced at Hidden Game of Tennis. The Match Charting Project records the depth of each return, coding each as a “7” (landing in the service box), an “8” (in back half of the court, but closer to the service line than the baseline), or a “9” (in the backmost quarter of the court). In the original formulation, RDI weights those depths 1, 2, and 4, respectively, and then calculates the average. I’ve tweaked it a bit to reflect the effectiveness of various return depths. For men, the weights are 1, 2, and 3.5, and for women, the weights are 1, 2, and 3.7.
  • Slice% – Slice/chip percentage. Of returns put in play, the percent that are slices or chips, including dropshots.

The return stats leaderboards also show most of these stats for first-serve returns only, and for second-serve returns only.