The Clutch Defense of Emma Navarro

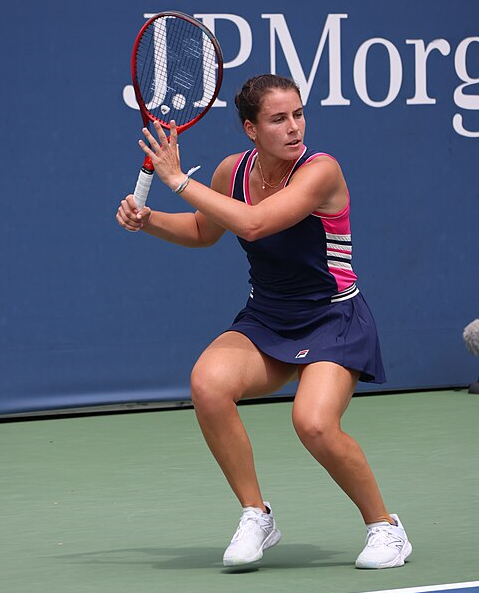
Emma Navarro at the 2023 US Open. Credit: Hameltion

The dizzying rise of Emma Navarro continues. She finished 2023 at a career-high 32nd in the rankings, rose to 23rd before Indian Wells, and now, on the back of yesterday’s upset of Aryna Sabalenka, she could crack the top 20 on Monday.

Not long ago, many fans thought of Navarro as a vulture, riding a bunch of small-tournament victories to an inflated ranking. Now, with back-to-back wins over Elina Svitolina and Sabalenka on one of the sport’s biggest stages–and not on clay, her favorite surface–the doubters are quieting down. The American already ranks 19th on the Elo table, another list she’ll continue to climb when this week’s results go in the books.

Yesterday’s triumph was less straightforward than it looks at first glance. The scoreline–6-3, 3-6, 6-2–hides just how close it was. Navarro won just 83 points to Sabalenka’s 80. The second-seeded Belarussian lost the match despite winning return points at a slightly higher clip than her opponent. Sabalenka’s ratio of winners to unforced errors was 38:28, the type of attack that has won her innumerable matches, and one that looks better than Navarro’s 21:16.

The underdog appeared to be the clever, resourceful player on court, making improbable returns and outlasting her more aggressive foe on the long points. Yet the numbers don’t bear out much of that, either. 20 points lasted at least seven strokes, and each player won 10. Sabalenka won five of the longest eight. Navarro’s returning won the day, as we shall see in a moment, but it was not particularly impressive against a far-from-peak Sabalenka. In the last year, opponents have gotten 70% of Aryna’s serves back in play. Navarro managed 67%.

Despite all that, Navarro walked off court with a smile on her face. What worked?

Timing is everything

The top-level answer is that Navarro converted break points, and Sabalenka didn’t. The underdog seized four of her five chances. In each game that she generated a break point, she secured the break. Sabalenka, on the other hand, earned more opportunities but took advantage of just two. She squandered a chance to put the first set back on serve at 5-3, and she could have erased Navarro’s break advantage at 3-1 in the decider. In neither of those games did the American slip again.

Break points, like points in tiebreaks, tend to be more complicated than average. Servers are a bit more careful to put balls in the court–and thus more conservative–and returners are hyper-focused. A high-pressure point is less likely to end with an unreturned serve; long rallies are more common. Navarro–with some help from her opponent–took this to an extreme.

The American, despite putting slightly fewer serves back in play than Sabalenka’s average opponent, kept the point going on each one of her five break points. She also returned every serve at 15-30, three of four at 30-30, and both at deuce. Here’s how Sabalenka’s rate of unreturned serves looks when separated by whether she was in trouble–defined as whether Navarro had already won two points in the game:

Situation       Points  Unret  Unret%  
Not In Trouble      51     16   31.4%  
In Trouble          22      4   18.2%

Even that distinction understates things. Two of Sabalenka’s unreturned serves in the “in trouble” category came at 40-30. When the second seed was really on the ropes, Navarro got the ball back on 15 of 17 tries. Pressure points are less likely to end quickly, but not by such an enormous margin.

Whether Sabalenka became uncharacteristically shaky under pressure, Navarro morphed into a return savant, or it was pure dumb luck, those few points determined the outcome of the match. In extended rallies, as we’ve seen, the American was not the overwhelmingly superior player, but that’s not the point. Sabalenka dominates most of her opponents by winning more cheap points than they do. If she wins just half of the rest of the points–on her serve and her opponent’s–she comes out on top. Take away most of the cheap points, and her edge is gone. Navarro won 24 of 49 return points–roughly half–when she put the ball back in play. Because she was so resourceful at key moments, she held Sabalenka to just 54% of serve points at 30-all or later.

Lessons

There are so many ways this match could have ended differently. Sabalenka could’ve served a little better under pressure, or Navarro could have returned a little worse. The whole scenario was made more likely by the conditions, slow-playing Indian Wells courts and balls, combined with wind that distracted the favorite more than the underdog.

Another culprit on the Belarussian side was Aryna’s plus-one. Eleven of her unforced errors came on the first shot after her serve, many of them wild and inexcusable, one of them two points away from defeat. It is to Navarro’s credit that she got so many serves back, but a more typical Sabalenka performance would have put away more of the desperate returns.

This is all a description of what happened last night, not speculation about a trend, or any kind of prediction. Sabalenka usually hits about as many unreturnable serves in pressure situations as she does at other times. In the limited data we have so far on Navarro, there’s no evidence that she is much better returning at key moments. Clutch performance in tennis is only rarely persistent: It’s easy to identify matches or tournaments when a player was particularly good or bad when it mattered most, more or less impossible to forecast it. If we hit rewind and replayed the match from the start, Navarro might still pull the upset, but it wouldn’t develop the same way.

What the match does give us is a little more evidence that Navarro is here to stay. She drew even with the second-best player in the world, staying calm enough throughout the proceedings to deliver her best tennis when the stakes were highest. She might not win a rematch with Sabalenka, but her position in the top 20–whether or not the WTA makes it official next week–is no fluke.

* * *

Subscribe to the blog to receive each new post by email:
 

What Is Going Wrong For Novak Djokovic?

Also: Arina Rodionova (probably) in the top 100

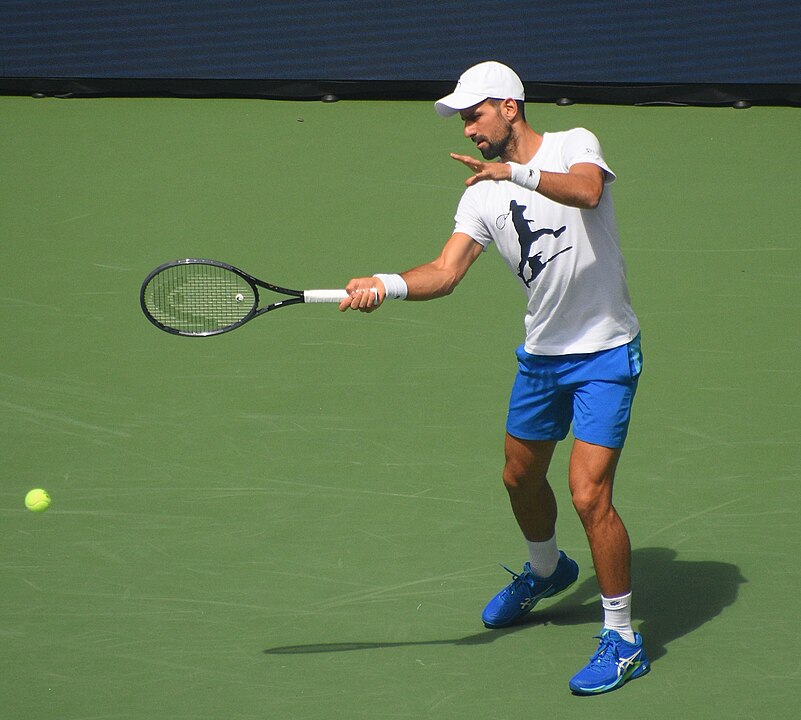
Novak Djokovic practicing at the 2023 US Open. Credit: Amaury Laporte

Fifteen break points. A week has passed, a new champion has been crowned, and I still can’t stop thinking about it. In the first two sets of his Australian Open quarter-final match against Taylor Fritz, Novak Djokovic failed to convert fifteen straight break points.

It’s so far out of character as to defy belief. Djokovic has converted more than 40% of his break chances in the past year, even counting the 4-for-21 showing in the entire Fritz match. The American, one of the better servers on tour, typically saves only two-thirds of the break points he faces. The chances that Novak would come up short 15 times in a row are about one in seven million.

Even stranger, it wasn’t because Fritz served so well. He missed his first serve on 7 of the 15 break points. He hit two aces and another four didn’t come back, but that leaves nine rallies when–under pressure, in Australia–Taylor Fritz beat Novak Djokovic. Five of those lasted at least seven strokes, including a 25-shot gutbuster at 4-3 in the second set that was followed, two points later, by yet another Fritz winner on the 17th shot. All credit to the American, who walked a tightrope of down-the-line backhands and refused to give in to an opponent who, even in the first two sets, was outplaying him. But clearly this wasn’t a matter of Fritz intimidating or otherwise imposing himself on Novak.

There’s no shortage of explanations. Djokovic is recovering from a wrist injury that hampered him in his United Cup loss to Alex de Minaur. He apparently had the flu going into the Melbourne semi against Jannik Sinner. The whole Australian adventure might be nothing more than a health-marred aberration; in this interpretation, none of Jiri Lehecka, Dino Prizmic, Alexei Popyrin, or even Fritz would otherwise have taken a set from the all-time great.

But… the man is 36 years old. If other tennis players his age are any guide, he may never be fully healthy again. He will continue to get slower, if only marginally so. He personally raised the physical demands of the sport, and finally, a younger generation has accepted the challenge. Djokovic has defied the odds to stay on top for as long as he has, but eventually he will fade, even if that means only a gentle tumble out of the top three. After a month like this, we have to ask, is it the beginning of the end?

Rally intolerance

The two marathon break points that Fritz saved were not exceptions. 64 of the 269 points in the quarter-final reached a seventh shot, and the American won more than half of them. Even among double-digit rallies, the results were roughly even.

Here’s another data point: Djokovic fought out 53 points in his first-rounder against Prizmic that reached ten shots or more. The 18-year-old Croatian won 30 of them. Yeah, Prizmic is a rising star with mountains of potential, but he’s also ranked 169th in the world. This is not the Novak we’ve learned to expect: Even after retooling his game around a bigger serve and shorter points, he remained unshakeable from the baseline, his famous flexibility keeping him in position to put one more ball back in play.

Down Under, though, those skills went missing. Based on 278 charted matches since the start of 2015, the following table shows the percentage of points each year that he takes to seven shots or more, and his success rate in those rallies:

Year  7+ Freq  7+ Win%  
2015    23.3%    54.9%  
2016    26.7%    53.1%  
2017    29.1%    53.3%  
2018    24.4%    52.6%  
2019    25.0%    55.1%  
2020    26.0%    54.3%  
2021    23.8%    53.6%  
2022    23.2%    54.7%  
2023    23.4%    54.1%  
2024    26.0%    49.8%

By the standards of tennis’s small margins, that’s what it looks like to fall off a cliff. The situation probably isn’t quite so bad: The sample from 2024 is limited to only the matches against Lehecka, de Minaur, Prizmic, Fritz, and Sinner. On the other hand, matches charted in previous years also skew in favor of novelty, so upsets, close matches, and elite opponents are overrepresented there too.

It is especially unusual for Djokovic to see such a decline on hard courts. Over the last decade, he has gone through spells when he loses more long rallies than he wins. But they typically come on clay. Carlos Alcaraz shut him down in last year’s Wimbledon final as well, winning 57% of points that reached the seventh shot and 63% of those with ten or more strokes. The only period when hard-court Novak consistently failed to win this category was late 2021, when Medvedev beat him for the US Open title (and then outscored him in long rallies in Paris), and Alexander Zverev won 62% of the seven-plusses (and 70% of ten-plusses!) to knock him out of the Tour Finals.

Protracted rallies are a young man’s game, and Djokovic’s results are starting to show it. Before dissecting Alcaraz in Turin last November, Novak had never won more than half of seven-plusses against Carlitos. He has barely held on against Sinner, winning 43% of those points in their Tour Finals round-robin match and 51% at the Davis Cup Finals. In 13 meetings since 2019, Medvedev has won more of these long rallies than Djokovic has. Zverev, too, has edged him out in this category since the end of 2018.

Against the rest of the pack, Djokovic manages just fine. He dominates seven-plusses against Casper Ruud and Stefanos Tsitsipas, for instance. But it’s one of the few chinks in his armor against the best, and if January represents anything more than the temporary struggles of an ailing star, more players are figuring out how to take advantage.

Avoiding danger

For players who lose a disproportionate number of long points, the best solution is to shorten them. Djokovic may never have thought in exactly those terms, but perhaps with an eye toward energy conservation, he has done exactly that.

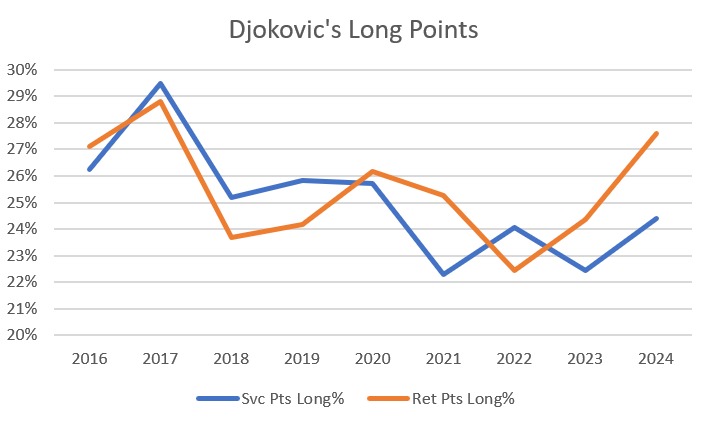
Especially from 2017 to 2022, Novak drastically reduced the number of points that reached the seven-shot threshold:

In 2017, 29% of his points went that long; in 2022 and 2023, barely 23% did. It remains to be seen whether January 2024 is more than a blip. In his up-and-down month, Novak remained able to control his service points, but he was less successful avoiding the grind on return. As we’ve seen, that’s dangerous territory: Djokovic won a healthy majority of the short points against Fritz but was less successful in the long ones, especially following the American’s own serve.

Much rests on the direction of these trends. If the players Djokovic has faced so far this year can prevent him from finishing points early, how will he handle Medvedev or Zverev?. If Novak can’t reliably outlast the likes of Fritz and Prizmic, what are his chances against Alcaraz?

Djokovic is well-positioned to hold on to his number one ranking until the French Open, when he’ll be 37 years old. By then, presumably, he’ll be clear of the ailments that held him back in Australia. Still, holding off the combination of Sinner, Alcaraz, Medvedev, Zverev, and Father Time will be increasingly difficult. The 24-time major champion will need to redouble the tactical effort to keep points short and somehow recover the magic that once made him so implacable in the longest rallies. Age is just a number, but few metrics are so ruthless in determining an athlete’s fate.

* * *

Arina Rodionova on the cusp of the top 100

In December, Australian veteran Arina Rodionova celebrated her 34th birthday. Now she’s competing at the tour-level event in Hua Hin this week, sporting a new career-best ranking of 101. With a first-round upset win over sixth-seed Yue Yuan, she’s up to 99th in the live rankings. Her exact position next Monday is still to be determined–a few other women could spoil the party with deep runs, or she could climb higher with more victories of her own–but a top-100 debut is likely.

Rodionova, assuming she makes it, will be the oldest woman ever* to crack the top 100 for the first time. The record is held by Tzipi Oblizer, who was two months short of her own 34th birthday when she reached the ranking milestone in 2007. Rodionova will be just the fifth player to join the top-100 club after turning 30.

* I say “ever” with some caution: I don’t have weekly rankings before the mid-80s, so I checked back to 1987. Before then, the tour skewed even younger, so I doubt there were 30-somethings breaking into the top 100. But it’s possible.

Here is the list of oldest top-100 debuts since 1987:

Player                    Milestone  Age at debut  
Arina Rodionova*         2024-02-05          34.1  
Tzipi Obziler            2007-02-19          33.8  
Adriana Villagran Reami  1988-08-01          32.0 
Emina Bektas             2023-11-06          30.6  
Nuria Parrizas Diaz      2021-08-16          30.1  
Mihaela Buzarnescu       2017-10-16          29.5  
Julie Ditty              2007-11-05          28.8  
Eva Bes Ostariz          2001-07-16          28.5  
Maryna Zanevska          2021-11-01          28.2  
Ysaline Bonaventure      2022-10-31          28.2  
Mashona Washington       2004-07-19          28.1  
Laura Pigossi            2022-08-29          28.1  
Maureen Drake            1999-02-01          27.9  
Hana Sromova             2005-11-07          27.6  
Laura Siegemund          2015-09-14          27.5

* pending!

I extended the list to 16 places in order to include Laura Siegemund. She and Buzarnescu are the only two women to crack the top 100 after their 27th birthdays yet still ascend to the top 30. The odds are against Rodionova doing the same–the average peak of the players on the list is 67, and the majority of them achieved the milestone a half-decade earlier–but you never know.

A triumph of scheduling

Rodionova has truly sweated her way to the top. She played 105 matches last year, winning 78 of them, assembling a haul of seven titles and another three finals. When I highlighted the exploits of Emma Navarro a couple of weeks ago, I couldn’t help but draw attention to the Australian, who is one of only two women to win more matches than Navarro since the beginning of last year. Iga Swiatek is the other.

Most of the veteran’s recent triumphs–44 match wins and five of her seven 2023 titles–have come at the ITF W25 level. She didn’t beat a single top-200 player in those events, and she faced only five of them. In her long slog through the tennis world last year, Rodionova played just one match against a top-100 opponent, and that was a loss to 91st-ranked Dalma Galfi.

The point is, the Aussie earned her ranking with quantity, not quality. No shame in that: The WTA made the rules, and the Australian not only chose a schedule to maximize her chances of climbing the ranking table, she executed. Kudos to her.

What her ranking does not mean, however, is that she is one of the 100 best players in the world. Elo is a more reliable judge of that, and going into this week, the algorithm ranks her 207th. (She peaked in the 140s, back in 2017.) You can hack the WTA rankings with a punishing slate of ITFs, but it’s much harder to cheat Elo.

Here are the players in the official top 150 who Elo considers to be most overrated:

Player             Elo Rank  WTA Rank  Ratio  
Caroline Dolehide       124        41    3.0  
Peyton Stearns          145        54    2.7  
Arantxa Rus             103        43    2.4  
Tatjana Maria            94        44    2.1  
Arina Rodionova         207       101    2.0  
Laura Pigossi           221       114    1.9  
Elina Avanesyan         120        62    1.9  
Varvara Gracheva         89        46    1.9  
Nadia Podoroska         127        67    1.9  
Lucia Bronzetti         109        58    1.9  
Dayana Yastremska        54        29    1.9

Once you climb into the top 100, savvy scheduling is increasingly impractical. Instead, this kind of gap comes from a deep run or two combined with many other unimpressive losses. Caroline Dolehide reached the final in Guadalajara followed by a quarter-final exit at a WTA 125, then lost three of five matches in Australia. Arantxa Rus won the title in Hamburg and reached a W100 semi-final, then lost five of six. The WTA formula lets you keep all the points from a big win for 52 weeks; Elo takes them away if you don’t keep demonstrating that you belong at the new level.

The sub-200 Elo rank suggests that Rodionova will have a hard time sustaining her place on the WTA list once the ranking points from her W25 titles start to come off the board. Until then, she can continue to pad her total and–fingers crossed–enjoy the hard-earned reward of a double-digit ranking.

* * *

Subscribe to the blog to receive each new post by email:
 

Yes, Jannik Sinner Really Is This Good

Also: Australian Open coverage recap

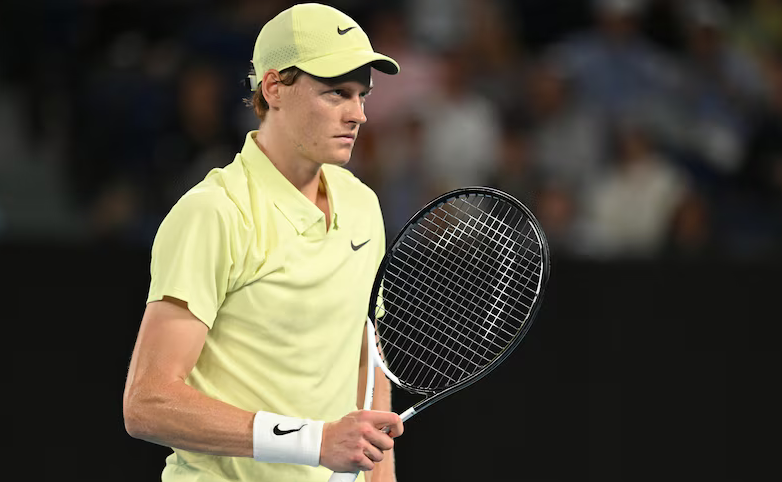
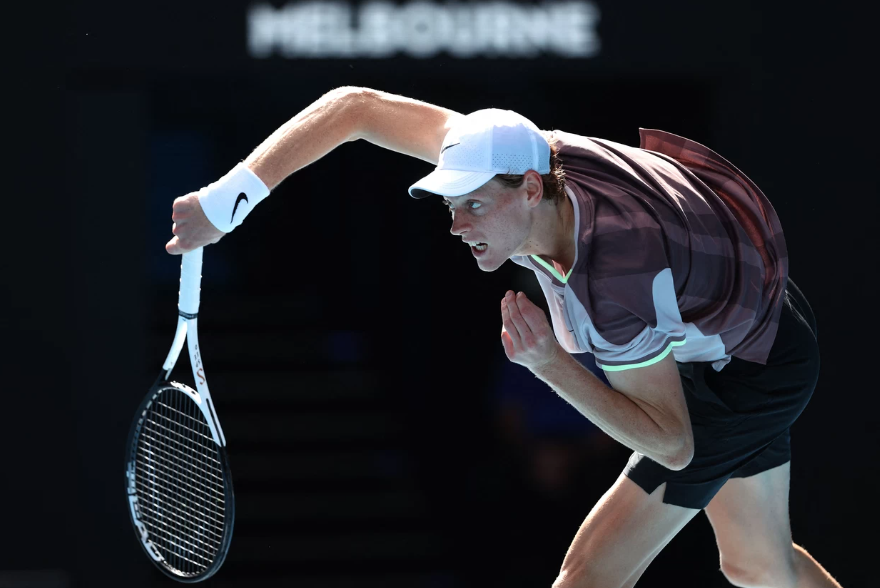
Jannik Sinner

Don’t let Daniil Medvedev’s near-miss in the Australian Open final fool you: Jannik Sinner is the best player in the world right now. Like Sunday’s championship match, it’s close–but it might not be close for long.

I wrote in December about what I called the “most exclusive clubs” in tennis. Since 1991, when the ATP began keeping these stats, Andre Agassi and Novak Djokovic have been the only two players to finish a season in the top three of both hold percentage and break percentage. (Agassi did it twice.) Well, in the last 52 weeks, Sinner ranks second in hold percentage behind Hubert Hurkacz, and he stands third in break percentage, trailing only Medvedev and Carlos Alcaraz. It’s not a calendar year so we can’t officially add him to the list, but he’s playing as well on both sides of the ball as anyone ever has, apart from two all-time greats.

Oh, and on hard courts, Sinner out-holds even Hurkacz. He gets broken less than anyone in the game, securing his serve 89.9% of the time.

But wait–it’s even better than that. Alex Gruskin pointed out that since Wimbledon, Sinner’s hold percentage is 91.1%, within shouting distance of John Isner’s career mark of 91.8%. Isner cracked the top ten by combining that monster serve with a return that only a mother could love. Sinner, on the other hand, pairs absolutely dominant serving with one of the best returns in the game. Ever wonder what would happen if Big John had an elite return? Now you know.

Starting the clock at Wimbledon might raise an eyebrow–is that just the line that spits out the most impressive number?–but it’s a sensible way to divide the data. In June, not long before the Championships, Sinner rolled out a new, simplified service motion. While the measurements of the new delivery are not overwhelming–one more mile per hour, four centimeters closer to the line, a 0.7 percentage-point increase in first serves in–the results have been devastating. His serve has always been good; perhaps a few minor tweaks were all it took to make it great.

Winning how?

First, a bit of a puzzle. In the last 52 weeks, Sinner ranks fifth on tour in serve points won, with 68.3%. (Why not first or second, in line with his hold percentage? We’ll come back to that.) Yet despite the Isner comparisons, he doesn’t get it done the easy way. He hits aces just 8.4% of the time. That’s equal to the average of the ATP top 50, and it’s fewer than Djokovic.

The answer doesn’t lie in unreturned serves, either. Some players do get more free points than their ace counts imply. Stefanos Tsitsipas, for instance, ranks well down the ace list, finishing just 9% of his serve points that way. But he looks much more elite when we measure how many don’t come back–almost one-third, in his case. Sinner’s 29.6% rate of unreturned serves is above average, but it’s hardly the stuff that record-breaking hold numbers are made of. The next man on the list, for comparison’s sake, is Frances Tiafoe.

What about plus-ones? Sinner serves big, but relatively speaking, his groundstrokes are even bigger. Can we explain his serve-game success by the rate at which he ends points with his second shot?

Still no! He wins 40% of his serve points by the third shot of the rally. Again, that’s a solid mark: Djokovic and Alcaraz are about the same. On the other hand, so is Jiri Lehecka, and Tiafoe is even better.

Once a point reaches the fourth or fifth shot–especially if it began with a second serve–winning it is more about contesting a rally than converting any lingering advantage of the serve. If the returner puts the fourth stroke of the point in play, he has a 52% chance of winning it. Big servers still get some easy putaways, but opportunities disappear as the rally develops. When that happens, winning service points relies on a different set of skills–assets that Sinner, unlike many a big server, amply possesses.

Sinner, then, has the whole package, even if no single one of his weapons stands out like the Isner serve. He serves big enough to clean up 40% of points with his first or second shot. It the point lasts longer, he has probably hung on to more of an advantage than most players do: His heavy, deep groundstrokes see to that. In a really long rally, okay, maybe the edge goes to Medvedev or Alcaraz, but who else is going to outlast the Italian?

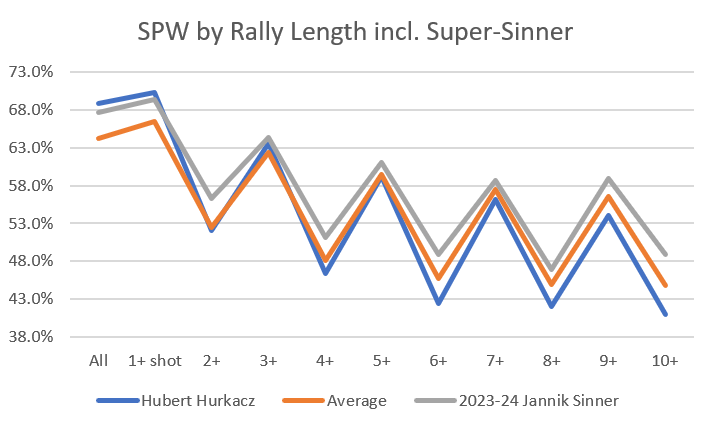
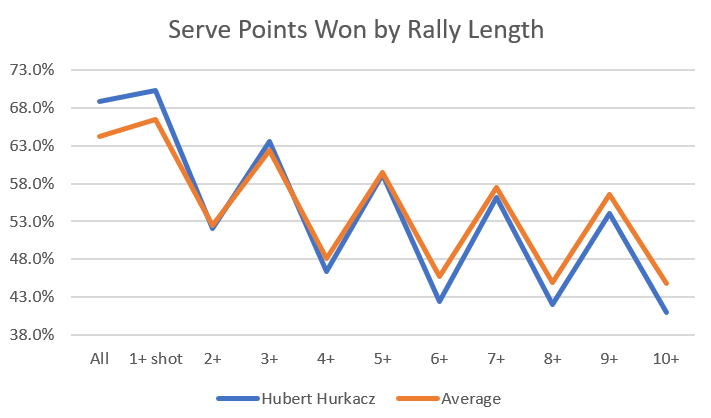
Most players excel at some stage of service points, but not all. The following graph illustrates how service points typically develop, by showing the server’s chance of winning the point when each successive shot is put in play. Based on charted men’s matches since 2021, servers win 64.2% of points. That goes up to 66.5% if they land a serve; it goes down to 52.5% if the return comes back. Several strokes later the server’s advantage is mostly gone: If he puts the 7th shot of the point in play, his chances of winning are 57.4%; if the returner comes back with an 8th shot, the server’s odds are down to 45%.

I’ve shown that progression along with specific numbers for Hurkacz, in order to demonstrate how these things go with our usual image of a big server:

While the differences between Hurkacz and tour average are modest, you get the idea. Early in the point, a big server cleans up; the longer the rally goes, the further his results fall below the line.

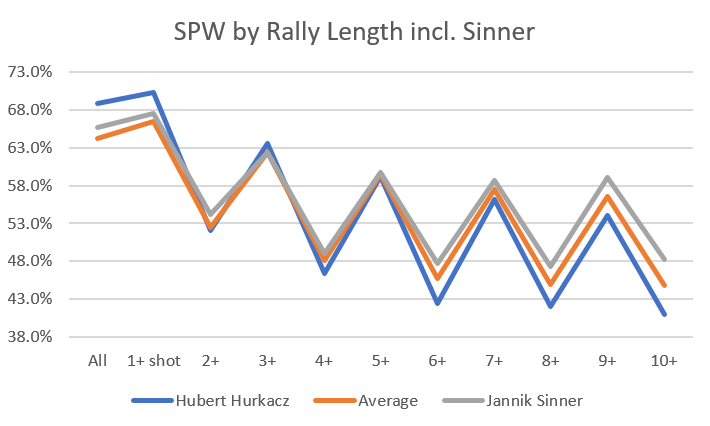
Now, the same graph with Sinner’s results from 2021 to the present:

He doesn’t start as high as Hurkacz, but he does do a little better than average. Crucially, he never falls below the average line, and the longer the point extends, the more he surpasses it.

I hope you’ve stuck with me this far, because the payoff is worth it. Same graph, only instead of Sinner’s three-plus-year average, we have his numbers since the beginning of 2023:

At the beginning of the point, Sinner is almost equal to Hurkacz. From then on, he takes over. A surprising gap comes early, at the two-plus rally mark, indicating that he doesn’t make many mistakes with his plus-one shot, even if he doesn’t put away an overwhelming number of them. No matter how long the point continues, the Italian outperforms tour average for that particular situation.

In tennis, it’s almost impossible to be good at everything. You can put together a nice, quite lucrative career by merely getting close to average in most categories and having one or two standout weapons. Sinner, we’re beginning to see, is not just good at everything, he is verging on great.

Break points

We now know why Sinner is winning so many serve points. But I mentioned another mystery we have yet to resolve. The Italian ranks fifth in the last 52 weeks in serve points won, the middle of a tightly-packed trio with Nicolas Jarry and Taylor Fritz, about one percentage point behind Hurkacz, Tsitsipas, and Djokovic. Yet he challenges Hurkacz for the top spot in the closely related, more consequential category of hold percentage:

Player               Hld% Rk   Hld%  SPW Rk   SPW%  
Hubert Hurkacz             1  89.1%       1  69.6%  
Jannik Sinner              2  88.8%       5  68.3%  
Stefanos Tsitsipas         3  88.4%       2  69.5%  
Novak Djokovic             4  87.6%       3  69.4%  
Nicolas Jarry              5  87.1%       4  68.4%  
Alexander Zverev           6  86.1%       7  67.4%  
Taylor Fritz               7  86.0%       6  68.2%  
Christopher Eubanks        8  85.8%       8  67.1%  
Carlos Alcaraz             9  85.7%      10  67.0%  
Tallon Griekspoor         10  85.1%      12  66.7%

The lists are almost identical, except for Sinner’s placement. He wins points at almost the same rate as Jarry and Fritz, yet he holds serve more often than either one.

As mysteries go, this isn’t a tough one. Not all points are created equal; if you win more of the important ones, you’ll outperform the players who don’t. Nobody knows that better than Sinner, who upset Djokovic in Turin despite winning exactly the same number of points, then beat him again at the Davis Cup with just 89 points to Novak’s 93. He out-pointed Medvedev yesterday 142 to 141.

Sinner wins these matches by saving break points at a remarkable clip. While winning 68.3% of serve points overall, he has held off 71.7% of break chances, including 36 of 40 in Melbourne. No one else on tour tops 69%, and Hurkacz comes in at 65%. On average, top-50 men save break points two percentage points less than they win typical serve points (63.5% to 65.5%), mostly because stronger returners generate more break points.

The question, then, is whether this is sustainable. ATP numbers indicate that Sinner goes bigger on break points, averaging 125 mile-per-hour first serves in those situations rather than his usual 122s. It seems to be working, but it can’t be that straightforward. Surely he isn’t the first player to arrive at the strategy of simply hitting harder, and besides, that usually comes at a cost. Will he continue to land enough of those bigger first serves to justify the payoff?

I can’t answer that question, but I can tell you what usually happens after a season of break-point overperformance: It doesn’t last. Taking over 2,600 player-seasons since 1991, 582 (21.7%) of players saved more break points than they won serve points overall. 183 (6.8%) matched Sinner’s mark of saving at least two percentage points more than their serve-points-won rate.

Of those 183, just eleven repeated the feat the following year. None of them were big servers, and nobody managed it three years in a row. The average following-year performance of the 183 men was 1.5 percentage points fewer break points saved than their rate of serve points won–just a tick better than tour average.

Unless Sinner has developed a new secret sauce–to be clear, with Darren Cahill in his corner, I’m not ruling it out!–that’s probably the fate that awaits him. In more than three decades, only 23 men have saved at least 71.7% of the break points they faced for a full season. The Italian probably won’t keep that up, and his out-of-this-world hold percentage will fall to something more plausible, in the 86-87% range.

Fortunately, that’s still exceptionally good. The 22-year-old serves like Jarry or Fritz while racking up as many return points as Djokovic. Take away the break point magic and you still have a contender for every slam. Sinner continues to lurk in fourth place in the official ATP rankings, but as of today, he is number one on the Elo list. Before long, those positions will converge, and it won’t be because his Elo rating goes back down.

* * *

AO recap

I hope you’ve enjoyed my coverage throughout the Australian Open. I’ll continue to write this sort of thing throughout the year, though not always every weekday!

In case you missed it, here are the ten other articles posted since the action in Melbourne began:

Thank you for reading.

* * *

Subscribe to the blog to receive each new post by email:
 

Aryna Sabalenka Under Pressure

Also today: January 26, 1924

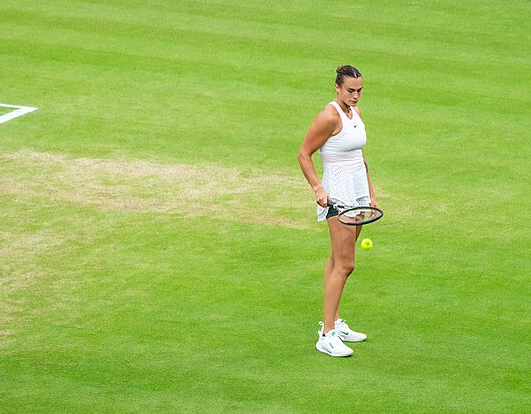
Aryna Sabalenka at Wimbledon in 2023. Credit: Adrian Scottow

It felt like a pivotal moment. Aryna Sabalenka had taken a 5-2 first-set lead in yesterday’s Australian Open semi-final against Coco Gauff. Gauff kept the set going with a strong service game for 5-3. Sabalenka lost the first point on her serve, but bounced back with a plus-one backhand winner.

At 30-15, the American struck again. She took advantage of a Sabalenka second serve to drag the Belarusian into a backhand rally, ultimately drawing an unforced error on the ninth shot and putting the game back in play.

Then, still just two points from the set, Sabalenka double-faulted.

The narrative practically writes itself. Aryna hits hard, aims for the lines, and keeps points short. Let her do that, and she will destroy you. Her first five opponents in Melbourne managed a grand total of 16 games against her. On the other hand, if you keep the ball in play, she’ll start pressing, trying too hard to dictate with her serve, going for too much when a smackable groundstroke presents itself.

Gauff, by this reading, is Sabalenka’s nightmare opponent. She won the US Open final by denying the Belarusian one would-be winner after another. Not only can she take Sabalenka’s game away from her, but Coco–at least on a good day–won’t give it back on her own serve. When she lets loose, Gauff wields just as much power as her more tactically aggressive opponent.

As it turned out, Sabalenka did lose that service game. Several twists and turns later, Gauff led the set, 6-5. Only then did Aryna regroup, winning four straight points from 30-love to force a tiebreak, then dropping just two more points to clinch the set. Gauff kept the second set close, but Sabalenka never allowed her to reach break point. The contest closed with a narrative-busting move: Facing match point, Gauff pulled out a 12-stroke rally, the kind of point that has been known to steer her opponent off course. But instead of compounding the damage, Sabalenka came back with two unreturned serves. Game over.

What to believe, then? Was the apparent first-set turning point a reflection of the true Sabalenka? Or is this the new Aryna, who slams the door when challengers sniff opportunity? Or is it something else, the all-too-common story in which someone looks like a clutch hero or a constant choker, only for us to discover, after crunching all the numbers, that she’s impervious to momentum and plays pretty much the same all the time?

Recovering at a disadvantage

Sabalenka’s serve games do follow a pattern after she loses a longish rally. But the results are not entirely straightforward.

On the next point (assuming the lost rally didn’t end the service game), Aryna is more likely to miss her first serve:

Year   1stIn%  post-rallyL-1stIn%  Change  
2019    61.2%               55.9%   -8.6%  
2020    61.5%               57.0%   -7.3%  
2021    58.6%               52.6%  -10.3%  
2022    60.0%               59.9%    0.0%  
2023    61.1%               61.3%    0.4%  
2024    63.3%               62.5%   -1.2%
----  
TOTAL   60.5%               57.6%   -4.8% 

Most of the effect is concentrated in the earlier years of her career on tour. Yesterday, the trend ran in the opposite direction: She made nearly 76% of her first serves overall, but after Gauff won a rally, she landed 88% of them.

The trend is clearer–and persisting to the present–when we look at double faults after losing a rally:

Year     DF%  post-rallyL-DF%  Change  
2019    8.6%            10.4%   20.8%  
2020    6.2%             8.4%   36.9%  
2021    7.9%            11.8%   50.3%  
2022   10.7%            10.1%   -5.5%  
2023    6.2%             7.2%   16.5%  
2024    3.4%             8.3%  144.7%  
----
TOTAL   7.9%             9.6%   22.5%

2022 was Aryna’s year of the yips; she was more likely to bunch double faults together than hit them in particularly nervy spots. (Put another way: Every spot was a nervy one.) The 2024 number will surely come back to earth, but it is still revealing: Sabalenka has made so much progress in this aspect of her game, but her second-serve struggles continue when she faces the threat of getting dragged into another rally.

Some of these effects persist even longer. From those service games that last long enough, here are Sabalenka’s first-in and double-fault percentages two points after losing a long rally:

Year   1stIn%  +2 1stIn%  Change    DF%  +2 DF%  Change  
2019    61.2%      55.8%   -8.8%   8.6%    8.7%    1.2%  
2020    61.5%      50.5%  -17.9%   6.2%    7.2%   17.1%  
2021    58.6%      56.0%   -4.5%   7.9%    8.7%   10.5%  
2022    60.0%      63.1%    5.3%  10.7%    7.8%  -27.1%  
2023    61.1%      59.2%   -3.2%   6.2%    8.4%   35.6%  
2024    63.3%      57.1%   -9.7%   3.4%    2.4%  -30.1%  
----
TOTAL   60.5%      57.1%   -5.6%   7.9%    8.0%    2.0% 

She continues to miss more first serves even two points after the rally setback. To some degree, the memory should have dissipated–after all, something else happened on the intervening point. On the other hand, she’s back in the same court. If a reliable serve didn’t work in the deuce court at 30-love, there’s reason to doubt it at 30-all.

The double fault trends are less clear, in part because our sample size is shrinking and double faults are blessedly rare. If nothing else, it’s safe to conclude that the explosion of double faults on the point after the lost rally doesn’t continue to nearly the same degree.

Tallying the cost

Now, this all seems bad. Sabalenka possesses one of the best first serves in the game; her whole attack is built around it. Her emergence as a superstar came after she got control of the service yips and cut her double faults down to manageable levels. After losing a long rally, she needs her serve more than ever, and–at least by comparison with other situations–it isn’t there for her.

Except… it doesn’t matter! At least not on the first point. Here is the bottom-line figure of service points won:

Year    SPW%  post-rallyL-SPW%  Change  
2019   59.6%             63.8%    7.2%  
2020   60.3%             56.6%   -6.0%  
2021   61.5%             61.3%   -0.3%  
2022   57.2%             59.9%    4.7%  
2023   63.7%             63.9%    0.4%  
2024   66.7%             70.8%    6.3%  
----
TOTAL  60.7%             61.7%    1.6% 

Fewer first serves, but more serve points won. It isn’t supposed to work like that, but Sabalenka bounces back strong from lost rallies. A shift of +1.6% in her favor is solid enough, and it’s even better if you look solely at the last three years.

Part of the explanation is that she tightens up the rest of her game–exactly the opposite of what my off-the-cuff narrative suggests. Under pressure, I hypothesized, she would try too hard to end points. Instead, after losing a long rally, she’s more willing than usual to play another one: She commits 14% fewer plus-one errors than her usual rate, implying a lower rate of aggression when she has an early chance to put the point away.

On the second point after losing a long rally, the bottom-line outcomes are more mixed:

Year    SPW%  +2 SPW%  Change  
2019   59.6%    53.9%   -9.5%  
2020   60.3%    55.3%   -8.3%  
2021   61.5%    58.5%   -4.9%  
2022   57.2%    61.5%    7.4%  
2023   63.7%    60.7%   -4.7%  
2024   66.7%    71.4%    7.1% 
---- 
TOTAL  60.7%    58.2%   -4.0%

While these aren’t as rosy as the next-point results, focus on the last few years. Since the beginning of 2022, Aryna has won more service points than usual when she returns to the serving direction where she recently lost a long rally–despite landing fewer first serves. She is even stingier with plus-one errors on these points, coughing up 29% fewer than usual.

These trends did not hold in yesterday’s semi-final. While Sabalenka made more first serves on the two points after Gauff outlasted her in a rally, fewer of them ended in her favor: 4% less on the first point, 12% less on the second. We can’t read too much into single-match totals with stats like these: 4% is a difference of one point. And Gauff is a far superior returner and baseline player than the typical WTAer, one who is unlikely to lose focus after going toe to toe with Sabalenka for a point or two. The average player pushes Aryna to a seventh shot barely one-tenth of the time; Gauff did so on one of every six points yesterday.

All of this leads us to an unexpected conclusion: Does Aryna Sabalenka have nerves of steel? First serves and double faults are just components in a larger picture; when we measure her results by points won, Sabalenka serves more successfully right after an opponent makes her uncomfortable. The yips are gone, and the on-court histrionics are a diversion that deceived us all. Aryna under pressure may be even more fearsome than her typical, terrifying self.

* * *

January 26, 1924: Suzanne’s longest day

Suzanne Lenglen wasn’t accustomed to spending much time on court. In eight tournaments since the 1923 Championships at Wimbledon, she had lost just ten games. Her doubles matches, especially with net maven Elizabeth Ryan at her side, were often just as lopsided. She never missed, she could put the ball anywhere on the court, and most opponents were lucky just to win a single point.

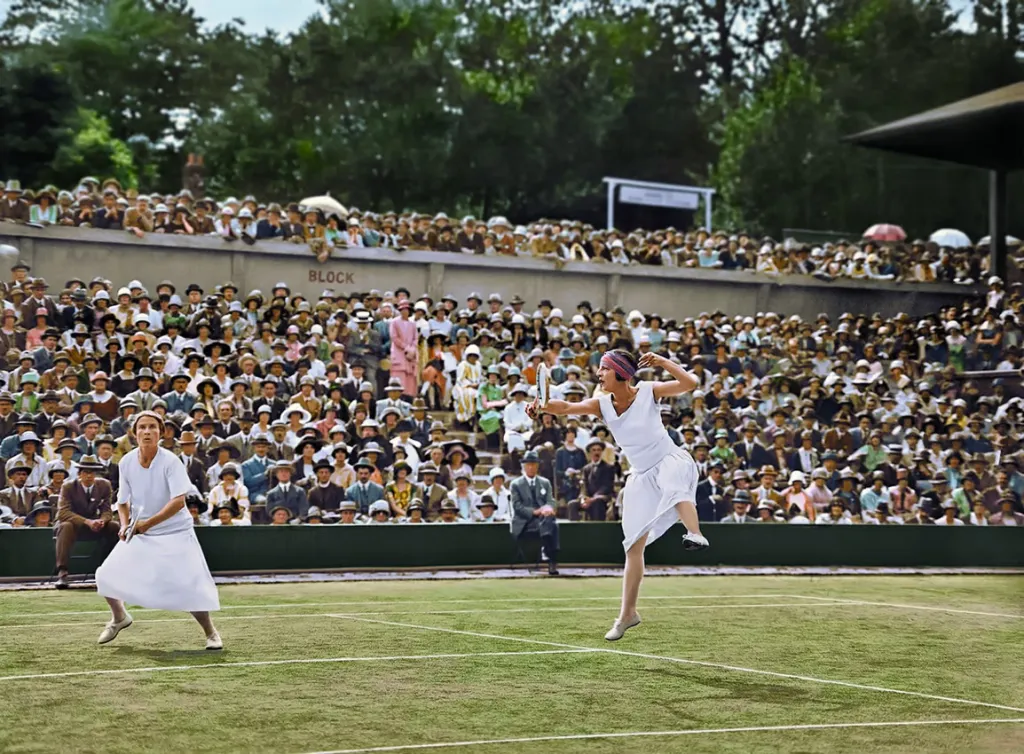
Lenglen and Ryan in 1925 at Wimbledon. Colorization credit: Women’s Tennis Colorizations

In January 1924, Lenglen eased her way back onto the circuit. Battling some combination of illness, anxiety, and hypochondria, she didn’t return to singles action until February. (She’d win her first three matches before dropping a game.) But she was a celebrity on the French Riviera, and she was prevailed upon to compete in doubles. She won the mixed at the Hotel Beau-Site tournament in Cannes to ring in the new year, and she entered both the women’s doubles–with Ryan–and the mixed at the Hotel Gallia tournament a few weeks later.

On the 26th, Lenglen and Ryan completed their waltz through the draw, defeating a British pair, Phyllis Covell and Dorothy Shepherd-Barron, 6-3, 6-4. Suzanne’s most aggravating foe was another Brit, a line judge with the temerity to call a foot-fault on the five-time Wimbledon champion. She tried to get the man removed and ultimately had to settle for his “voluntary” departure. “It is unfair,” she said. “The English are pigs.”

Her nerves would be tested even more severely in the mixed doubles final. Lenglen partnered Charles Aeschlimann of Switzerland, while Ryan teamed with the 43-year-old Canadian Henry Mayes. Both men were better known on the Riviera than in the tennis world at large, more clubbable than talented. Lenglen and Ryan–herself one of the top few woman players in the world–would be the stars of the show.

Lenglen and Aeschlimann took the first set, 6-4; Ryan and Mayes came back with a 6-1 frame of their own. The underdogs–that is, the team without Suzanne–built up an early lead in the third, thanks to Aeschlimann’s inconsistency and Ryan’s glittering play. Mayes served for a 4-2 advantage, but a lucky netcord halted their momentum, and the deciding set settled into a rhythm it wouldn’t break for 20 more games.

Only at 13-14 did Ryan finally give in. She gifted a double fault to her opponents, and Mayes’s fatigue–he had played a four-set men’s doubles final beforehand–began to tell. Lenglen and Aeschlimann broke serve, securing the 6-4, 1-6, 15-13 victory. It would stand as the longest set of Suzanne’s unparalleled career.

* * *

Subscribe to the blog to receive each new post by email:
 

How To Play One-Set Shootouts Like Daniil Medvedev

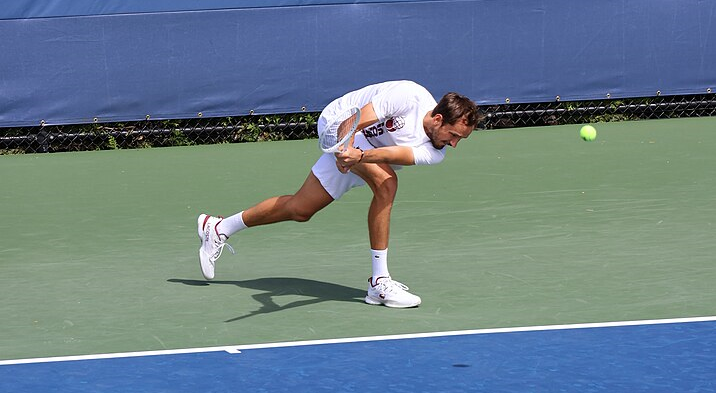
Daniil Medvedev in 2023, practicing… something. Credit: Hameltion

In yesterday’s Australian Open quarter-final match against Hubert Hurkacz, Daniil Medvedev came through with his second five-set win of the tournament. In the decider, Hurkacz’s level dropped, Medvedev kept his ground game tight, and the Russian converted the one break point on offer. Four hours of tennis, compressed into a few crucial moments, and Medvedev has a place in the semi-finals.

Not long ago, Medvedev gained a reputation as a disappointment in deciding sets. He lost 11 of 15 three- and five-setters in 2022, and yesterday’s match was the first time in nine tries–going back to Melbourne two years ago–that he had beaten a top-ten player in a climactic set.

But such trends are easy to exaggerate. For one, three of those eight consecutive losses were clustered at the 2022 Tour Finals, where the Russian managed, remarkably, to drop third-set tiebreaks in all of his round-robin matches. Not the best way to ensure a restful offseason, but hardly an indictment of his ability to hang around late into matches with the best players in the game.

Further, except for the 2022 season, Medvedev has developed a knack for cleaning up close matches with everybody else:

Year   Decider W-L  Decider W%  
2024           2-0      100.0%  
2023          14-6       70.0%  
2022          4-11       26.7%  
2021          14-5       73.7%  
2020           9-4       69.2%  
2019         10-11       47.6%  
2018          16-9       64.0%  
2017          13-6       68.4%  
2016          23-9       71.9% 
---- 
Total       105-61       63.3%

2016 shouldn’t really count, since it’s a mix of ITFs, Challengers, and early forays onto the main tour, but given the results, I figured it was worth including. Wherever you draw the line, it’s hardly the case that Medvedev struggles in such matches. Recently, I looked into what a player’s third-set record “should” be, given their skill level, and a mark above 60% is better than expected for nearly anyone.

You might argue that the Russian shouldn’t have racked up so many deciders. He was expected to finish off Emil Ruusuvuori much more quickly than he did in the second round in Australia, and even on clay, he should never have gotten dragged to a fifth set at Roland Garros by Thiago Seyboth Wild, much less lost it. But everyone takes the scenic route sometimes. 14 of Medvedev’s deciding sets last year came against the top 50, 10 of them against the top 20.

The final set shift

When a match is reduced to a one-set shootout, it becomes a bit less serve-centric. This is a persistent finding in all high-pressure situations, from tiebreaks to break points to fifth sets. Servers get a bit more cautious, returners heighten their focus, and quick points are harder to come by.

The effects are small but real. In the 1,200-plus men’s deciding sets since 2017 logged by the Match Charting Project, servers win 1.1% fewer points in the final set that they did in the first two or four. They land fractionally more of their first serves, but only by increasing their margins: The percent of unreturned serves falls by more than 5%. The average rally increases from 4.1 strokes to 4.3.

There are two fundamental ways to benefit from those changes. First, you can buck the trend, continuing to serve big while your opponent succumbs to the natural tendency toward caution. That’s part of the reason that John Isner and Roger Federer were two of the very few players to win more tiebreaks than expected over long periods of time. It’s not easy, especially if fatigue is setting in. But if you can keep serving the way you did for two or four sets, you have a minor edge in the decider.

Second, you can be the type of player who excels in deciding-set-style tennis. If you had to pick between Medvedev and Hurkacz in a contest where more serves would come back and points would last longer, the choice is simple, right? It’s no guarantee, to be sure: The shift is a minor one, and it may not show up in any given match. Yesterday, more points were decided in four shots or less in the fifth set than in the first four. But on average, the trend moves in the other direction, right into the Russian’s wheelhouse.

Evidence shows that Medvedev follows these prescriptions, maintaining his attack on serve while taking advantage of more cautious opponents. Other top players, to varying degrees, do the same.

Let’s start with the basics. For each stat, I calculated every player’s performance in deciding sets, and in all previous sets. The numbers I’m about to show you are the ratio between those numbers, a measure of how much their tactics change when the final set begins. Positive numbers mean they do more of it in the decider, negative means they do less. We’ll look at the four Australian Open semi-finalists, plus Carlos Alcaraz (because of course) and Hurkacz (because of his deciding-set notoriety). Keep in mind that Novak Djokovic’s figures are limited to matches since 2017.

Here are the rate of serve points won, and the rate of first serves in:

Player             SPW%  1stIn%  
Carlos Alcaraz     3.9%    4.4%  
Jannik Sinner      2.6%   -1.2%  
Novak Djokovic     1.5%   -1.1%  
Hubert Hurkacz     0.8%   -1.9%  
-- Average --     -1.1%    0.7%  
Daniil Medvedev   -1.2%   -1.7%  
Alexander Zverev  -4.5%    3.2%

Medvedev is in line with tour average when it comes to winning service points: He doesn’t hold on to as many in deciding sets. Average isn’t bad in this case, though it looks mediocre in this company. A more encouraging sign, at least in terms of the tactical approach, is the change in first serves in. The Russian, in line with Djokovic, Hurkacz, and Jannik Sinner, seems to take a few more chances in the shootout. Alcaraz defies gravity, serving more conservatively yet winning more points, and Zverev looks out of place, a caricature of prudence.

Now let’s look at the percentage of serves that don’t come back (Unret%), as well as the percent of service points won in three shots or less (SPW% <=3):

Player            Unret%  SPW% <=3  
Novak Djokovic     10.9%      5.4%  
Carlos Alcaraz      0.2%      1.0%  
Daniil Medvedev    -0.6%     -2.0%  
Hubert Hurkacz     -1.1%      0.2%  
-- Average --      -5.7%     -3.6%  
Jannik Sinner      -7.4%      0.3%  
Alexander Zverev  -13.4%    -11.2%

The first rule of writing about men's tennis: Whatever the topic, you'll eventually end up showering praise on Djokovic. In recent years, he has learned how to get more out of his serve, and he turns that knob even further in deciding sets. Most players struggle to simply stay above water in the final set; Djokovic starts serving bigger.

Medvedev's rate of unreturned serves is the sort of positive sign it takes a connoisseur to appreciate: "-0.6%" doesn't turn up on many Hall of Fame plaques. But when the typical player serves so much more carefully, the Russian's consistency works to his advantage. His three-shots-or-less win rate does not stand out as much, but it is still less of a step backward than the typical tour player takes.

Once again, deciding-set Alexander Zverev is an unusual beast.

Opportunistic returning

If the challenge on serve is to keep attacking in the final set, the task on return is to take advantage of an opponent who probably isn't doing that. Ideally, that might mean more aggression on the return, but a 1% or 5% weaker first serve is still only so playable. Instead, players should make sure not to squander the chances they're given: Make more returns, then tighten up the ground game for the inevitable rallies.

Here are three stats to illustrate deciding-set return tendencies, again expressed as ratios between how each player performs in the final set, compared to previous sets:

Player            Ret InPlay%  UFE/Pt    FH%  
Alexander Zverev         6.7%    1.1%   1.0%  
Daniil Medvedev          3.9%   -3.2%  -1.2%  
Novak Djokovic           3.0%  -10.5%   1.5%  
Hubert Hurkacz           2.9%   -1.7%   0.3%  
Carlos Alcaraz           2.7%  -10.4%  -1.9%  
-- Average --            2.5%   -2.4%  -0.3%  
Jannik Sinner           -1.2%    0.1%   0.4%

Zverev, as we might have guessed, gets a lot of deciding-set returns in play. He's exceedingly conservative by every other measure we've seen, so why not here? Behind him, heading the non-pusher category, is Medvedev, who gets nearly 4% more returns in play in the final set that he did up to that point.

Unlike Zverev, the Russian also stays in control throughout the rally. He doesn't suddenly discover the otherworldly control of Djokovic and Alcaraz, who somehow reduce their unforced error rates by 10% in the deciding set, but he leads the rest of the pack, cutting down his mistakes by more than the tour average.

The third metric shown here--forehands as a percentage of all groundstrokes--is simply a curiosity. There's no right or wrong way to choose strokes, at least not at the level of the whole tour. As we saw last week, Medvedev and Zverev go for backhands on the plus-one shot more than anyone else, because they are in the unusual position that it might really be their stronger option. If a player improves his ground game in the fifth set--and this is nothing more than a hypothesis--it might show up in the numbers as more shots from his preferred wing. None of these men show a dramatic shift in shot selection, but I can't help but notice that Medvedev hits a few more backhands in the final set than he did in the two of four sets it took to get there.

If Medvedev reaches a fifth set in tomorrow's semi-final against Zverev, he won't need this level of savvy to know what's going on. The German's tactics, whether by design or instinct, are abundantly clear. Zverev can turn a shootout into a war of attrition, with two fifth-set tiebreaks already in Melbourne and an astonishing record of 22 deciding sets won in his last 26 attempts. While it will doubtless be a grind, the Russian might just be able to use his opponent's passivity against him. Faced with the tiny margins of a grand slam fifth set, every edge is worth exploiting.

* * *

Subscribe to the blog to receive each new post by email:
 

What Is Ben Shelton’s Ceiling?

Also today: First serve stats, and new Tennis Abstract reports.

Ben Shelton. Credit: 350z33

Ben Shelton is one of the rising stars of men’s tennis, the most exciting young player this side of Carlos Alcaraz. He possesses a monster serve, he’s not afraid to unleash old-school tactics, and he wears his heart on his sleeve. It’s impossible to root against this guy.

Shelton is also, by the standards of the game’s elite, not a very good returner.

Any discussion of his potential has to come to terms with this most obvious limitation. His rocket of a lefty serve will never hold him back; indeed, it’s already earned him places in the US Open semi-finals and the Australian Open quarters. You don’t have to do much dreaming to see him going even further and winning a major outright. What’s tougher to forecast is the sort of sustained performance that would take him to the top of the rankings.

Last year, Shelton won 32.6% of his return points at tour level. Average among the top 50 was 37.1%, and the top four players on the circuit (and Alex de Minaur) all topped 40%. Of the top 50, only Christopher Eubanks, at 30.9%, came in below Shelton.

There’s plenty of time for Ben to improve, and I’ll get to that in a moment. But first, let me show you the list of the year-end top-ten players with the lowest percentage of return points won (RPW%) since 1991, when the ATP began to keep these stats:

Player              Season  Rank   RPW%  
John Isner            2018    10  29.4%  
Kevin Anderson        2018     6  33.7%  
Milos Raonic          2014     8  33.8%  
Andy Roddick          2007     6  34.0%  
Hubert Hurkacz        2023     9  34.3%  
Greg Rusedski         1997     6  34.5%  
Matteo Berrettini     2019     8  34.6%  
Ivan Ljubicic         2005     9  34.6%  
Hubert Hurkacz        2022    10  34.7%  
Greg Rusedski         1998     9  34.7%  
Stefanos Tsitsipas    2023     6  34.7%  
Mark Philippoussis    2003     9  34.8%  
Andy Roddick          2010     8  34.9%  
Pete Sampras          1996     1  35.3%  
Jo Wilfried Tsonga    2009    10  35.3%  
Goran Ivanisevic      1995    10  35.4%  
Andy Roddick          2009     7  35.5%  
Pete Sampras          2000     3  35.5%  
Pete Sampras          2001    10  35.6%  
Andy Roddick          2008     8  35.6%

In 33 years, out of 330 top-ten finishes, only one man has reached the threshold with a RPW% lower than Shelton’s last year. And it’s someone you can’t exactly pattern a career after: If you look up “outlier” in the dictionary, you find John Isner’s face staring back at you.

Even more striking to me is that no one has finished in the top five with a RPW% below 35%. Then comes another outlier, Pete Sampras and his 1996 campaign. If your goal is to finish a season at number one, you’ll usually need a strong return. Sampras and Andy Roddick are the only two men who have topped the rankings with a RPW% below 38%. Otherwise, you’ve got to ask yourself one question: Are you Pete Sampras?

Here are the lowest RPW% numbers for top-three finishers since 1991:

Player           Season  Rank   RPW%  
Pete Sampras       1996     1  35.3%  
Pete Sampras       2000     3  35.5%  
Andy Roddick       2005     3  36.0%  
Milos Raonic       2016     3  36.1%  
Andy Roddick       2003     1  36.4%  
Casper Ruud        2022     3  36.9%  
Pete Sampras       1999     3  37.3%  
Andy Roddick       2004     2  37.5%  
Boris Becker       1994     3  37.6%  
Michael Stich      1993     2  37.9%  
Pete Sampras       1998     1  38.0%  
Marat Safin        2000     2  38.1%  
Grigor Dimitrov    2017     3  38.2%  
Patrick Rafter     1997     2  38.2%  
Roger Federer      2009     1  38.3%

(Did you expect to see Casper Ruud on this list? I did not.)

Shelton’s serve means that he could reach the top without the return-game success of Alcaraz or Novak Djokovic. But if he wants to move beyond the fringes of the top ten, this second table shows the range he needs to aim for. Setting aside the hot-and-cold tactics of Pistol Pete (we’ll come back to that, too), we can simplify things and say that a would-be world-beater needs to get his RPW% up around 36% or 37%.

How much can a return improve?

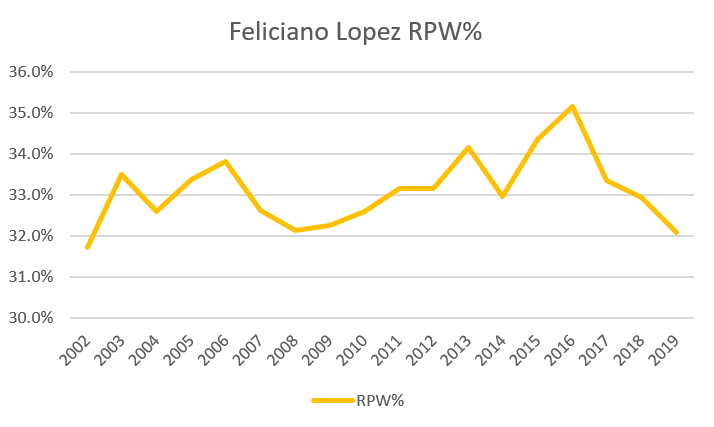
Bettering your core stats is possible, but not easy. Another lefty, Feliciano Lopez, offers a cautionary tale. In his age-20 season, he won 31.7% of return points, not far below Shelton’s mark. Here’s how his career developed:

Lopez didn’t top 34% for more than a decade, and he only reached 35% when he was 34 years old. In seven of his ten seasons between the ages of 21 and 30, his return was no more than 1.5 percentage points better than that first season.

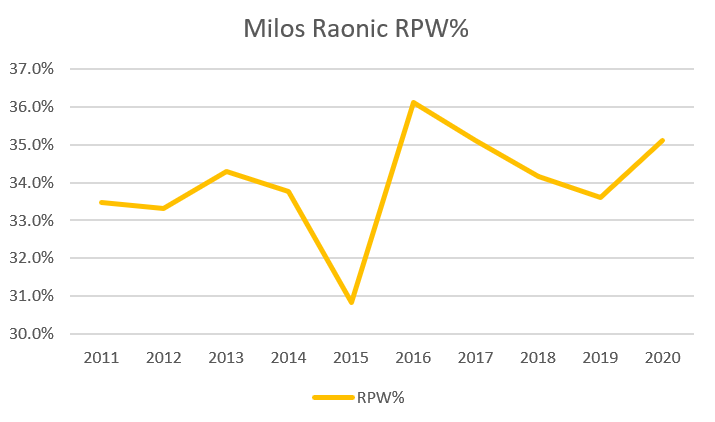
Here’s another one. Milos Raonic won 33.5% of his return points as a 20-year-old. He’s a better comp for Shelton, because Raonic’s serve was similarly effective as well. This graph shows how Raonic’s return evolved:

He barely improved on that 33.5% mark until 2016, when he peaked at number three in the ATP rankings, and he couldn’t sustain it. His career RPW% went into the books at 33.9%.

Many of you, I’m sure, are ready to object: Lopez was never the pure athlete that Shelton is! Raonic certainly wasn’t, and he played through one injury after another. Fair enough–if there are natural gifts that make it more likely that a player develops a tour-average return game after arriving on tour, Ben probably has them. Tough to argue with that.

Still, the numbers are brutal. There have been 99 players who racked up 20 or more tour-level matches in their age-20 season since 1991. 22 of them never improved–they never won return points at a higher rate than they did when they were 20. Of the lucky ones who managed to do better at some point in their careers, their peak was, on average, 1.7 percentage points higher than their age 20 number. For Shelton, that’s a peak RPW% of 34.3%, well below the targets established above.

Of that group of 99 20-year-olds, one out of ten improved (eventually) by at least ten percent–not percentage points–a gain that would move Shelton up to 35.9%, essentially the border of where he needs to be for a top-three finish. Let’s not understate the difficulty of the task. Players who reach tour level by age 20 are extremely promising, almost without exception, and Ben needs to put himself in the top tenth of that group.

It’s not obvious why boosting your return-game results is so difficult, or so rare. (It’s harder than improving serve stats, but that’s a topic for another day.) One factor is that as you climb the rankings, you face tougher opponents, so even if your game gets better, your stats appear to stagnate. The median rank of Shelton’s opponents last year was 54.5. The same number for Andrey Rublev is 40, and Daniil Medvedev’s was 27.

Another reason is that returning is a young man’s game. The skills that contribute to the service return–vision, reaction time, quickness, speed–peak early. I have no doubt that Lopez, Raonic, and just about everybody else on tour worked hard to get more out of their return over the years, but many of their gains simply cancelled out the losses they suffered from the aging process.

Beyond RPW%

Sampras was famous for tanking some return games, then going all-out late in the set. The energy-saving strategy was time-tested, going back another half-century to the “Big Game” theories of Jack Kramer and his mentor Cliff Roche. If you hold your serve (almost) every time you toe the line, you only need to break once–or win the tiebreak. Why waste the effort on every return point?

Shelton doesn’t go quite that far; he rarely looks apathetic on return. But he clearly gets energized when an opportunity presents itself, or when he decides it’s time to create one. If a player can consistently play better in big moments, his RPW% won’t tell the whole story. Nick Krygios did this on break points, though it wasn’t enough to get him into the top ten.

There’s some evidence that Shelton does as well. If he always played the same way–the level that earned him 32.6% of his return points–a simple model would predict that he would break serve 13.3% of the time. Instead, he broke 16% of the time, a rate that the model would have predicted for a returner winning 34.4% of points. Still not top-three territory, but getting closer.

Isner often overcame his return woes by securing more tiebreaks than his first-twelve-game performance would have suggested. He won more than 60% of his career breakers, coming close to a 70% mark in two separate seasons. Shelton might be using similar tactics, but he isn’t yet getting the same sort of results: He went a modest 18-16 in tiebreaks last season.

What about break points? This is one area where Sampras noticeably stepped up his game. From 1991 to 2000, he won 44 more break points than expected, based on his return-point stats on non-break points. It’s not a huge advantage–about one extra break of serve every 16 matches–but most players break even. This is one way in which Pete’s RPW% understated his effectiveness on return.

Here, Shelton really shines. My model suggests that he “should” have won break points at a 35.0% clip last year, since on average, players win break points more frequently than other return points. (Break points arise more often against weaker servers.) Incredibly, Ben won more than 41% of his break point chances. Instead of 96 breaks of serve, he earned 114. Since 1991, only a few dozen players have ever outperformed break point expectations by such a wide margin for a full season. Sampras never did, though he once got close.

If Shelton can sustain that level of break-point play, we might as well make room for him in the Hall of Fame right now. A modest improvement in RPW%, combined with reliably clutch performance in the big moments, would move him into the Sampras/Roddick range, where big servers can break serve just enough to catapult to the top of the rankings.

But… it’s a big if. Sampras averaged just four or five extra breaks per season, and he’s one of the all-time greats. In 2003, James Blake also exceeded break-point expectations by a margin of 18. The next year his score was negative 5. Across 2,600 pairs of player-seasons, there’s virtually no correlation between break point performance one year and the next. Shelton may defy the odds, just as Isner rewrote the book on tiebreak performance. But the smart money says that he won’t be so lucky this year.

Where does this leave us? If we’re optimistic about Shelton’s athleticism, commitment, and coaching team, there’s reason to expect that he’ll eventually win more return points–though probably not enough to reach the 36% threshold that usually marks off the top three. If he proves able to execute Kramer/Sampras/Kyrgios tactics under pressure, that might be enough to make up the difference. If he can do that, and he can remain as fearsome a server as he already appears to be, we might have a multi-slam winner, a top-three, maybe even number one player on our hands. The ceiling is high, but the ladder is steep.

* * *

First serve dominance

James Fawcette asks:

[At the United Cup] de Minaur lost only 1 point behind his first serve vs Djokovic, 33 of 34. Has anyone ever won every first serve point vs the then world number one in a completed match?

No!

Going back to 1991, when the ATP started keeping these stats, no one else lost only one, either. Here are the 18 matches in which a player lost three or fewer first-serve points against the world number one. In seven of the matches (noted with asterisks), all that big serving was for naught, and the favorite won anyway.

Tournament         Rd   Winner      Loser       Lost     
2024 United Cup    QF   de Minaur   Djokovic       1     
1992 Tour Finals   RR   Ivanisevic  Courier        2     
1993 Osaka         QF   Courier     Raoux          2  *  
1993 Tour Finals   RR   Sampras     Bruguera       2  *  
1996 Dusseldorf    RR   Kafelnikov  Sampras        2     
2000 Miami         SF   Kuerten     Agassi         2     
2002 Hamburg       QF   Safin       Hewitt         2     
2008 Indian Wells  SF   Fish        Federer        2     
2011 Tour Finals   RR   Ferrer      Djokovic       2     
1992 Paris         QF   Becker      Courier        3     
1992 Brussels      R16  Courier     Leconte        3  *  
1996 Tour Finals   SF   Sampras     Ivanisevic     3  *  
2000 Scottsdale    R16  Clavet      Agassi         3     
2002 Rome          R32  Moya        Hewitt         3     
2008 Halle         SF   Federer     Kiefer         3  *  
2008 Olympics      R64  Federer     Tursunov       3  *  
2010 Tour Finals   F    Federer     Nadal          3     
2018 Canada        R32  Nadal       Paire          3  *

* * *

New toys

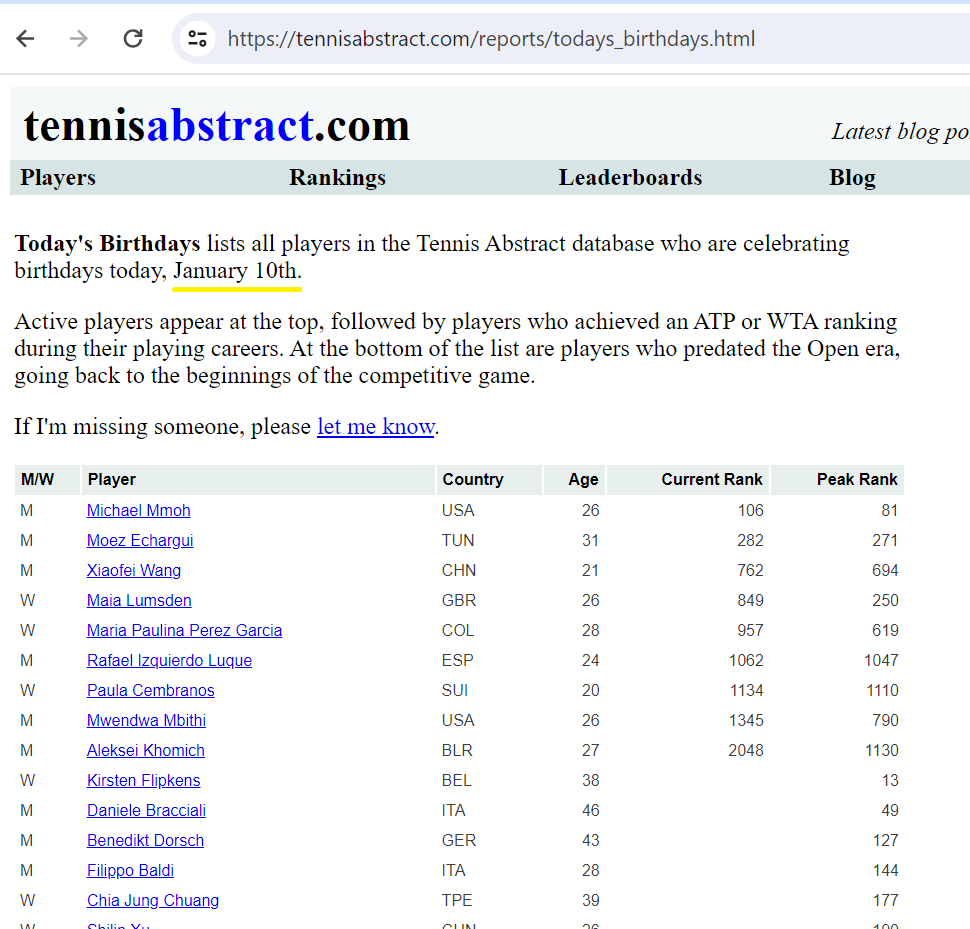
Yesterday I added two new features to Tennis Abstract. First, there’s a list of today’s birthdays:

Second, there’s a “Bakery Report” (one each for men and women) with comprehensive stats on 6-0 and 6-1 sets won and lost:

The birthday list will update daily, and the bakery report will refresh every Monday, expect in the middle of grand slams.

Enjoy!

* * *

Subscribe to the blog to receive each new post by email:
 

Roger Federer Wasn’t Clutch, But He Was Almost Clutch Enough

Italian translation at settesei.it

The stats from the Wimbledon final told a clear story. Over five sets, Roger Federer did most things slightly better than did his opponent, Novak Djokovic. Djokovic claimed a narrow victory because he won more of the most important points, something that doesn’t show up as clearly on the statsheet.

We can add to the traditional stats and quantify that sort of clutch play. A method that goes beyond simply counting break points or thinking back to obviously key moments is to use the leverage metric to assign a value to each point, according to its importance. After every point of the match, we can calculate an updated probability that each player will emerge victorious. A point such as 5-all in a tiebreak has the potential to shift the probability a great deal; 40-15 in the first game of the match does not.

Leverage quantifies that potential. The average point in a best-of-five match has a leverage of about 4%, and the most important points are several times that. Another way of saying that a player is “clutch” is that he is winning a disproportionate number of high-leverage points, even if he underwhelms at low-leverage moments.

Leverage ratio

In my match recap at The Economist, I took that one step further. While Djokovic won fewer points than Federer did, his successes mattered more. The average leverage of Djokovic’s points won was 7.9%, compared to Federer’s 7.2%. We can represent that difference in the form of a leverage ratio (LR), by dividing 7.9% by 7.2%, for a result of 1.1. A ratio of that magnitude is not unusual. In the 700-plus men’s grand slam matches in the Match Charting Project, the average LR of the more clutch player is 1.11. Djokovic’s excellence in key moments was not particularly rare, but in a close match such as the final, it was enough to make the difference.

Recording a leverage ratio above 1.0 is no guarantee of victory. In about 30% of these 700 best-of-five matches, a player came out on top despite winning–on average–less-important points than his opponent did. Some of the instances of low-LR winners border on the comical, such as the 2008 French Open final, in which Rafael Nadal drubbed Federer despite a LR of only 0.77. In blowouts, there just isn’t that much leverage to go around, so the number of points won matters a lot more than their timing. But un-clutch performances often translate to victory even in closer matches. Andy Murray won the 2008 US Open semi-final over Nadal in four sets despite a LR of 0.80, and in a very tight Wimbledon semi-final last year, Kevin Anderson snuck past John Isner with a LR of 0.88.

You don’t need a spreadsheet to recognize that tennis matches are decided by a mix of overall and clutch performance. The numbers I’ve shown you so far don’t advance our understanding much, at least not in a rigorous way. That’s the next step.

DR, meet BLR

Regular users of Tennis Abstract player pages are familiar with Dominance Ratio (DR), a stat invented by Carl Bialik that re-casts total points won. DR is calculated by dividing a player’s rate of return points won by his rate of service points lost (his opponent’s rate of return points won), so the DR for a player who is equal on serve and return is exactly 1.0.

Winners are usually above 1.0 and losers below 1.0. In the Wimbledon final, Djokovic’s DR was 0.87, which is extremely low for a winner, though not unheard of. DR balances the effect of serve performance and return performance (unlike total points won, which can skew in one direction if there are many more serve points than return points, or vice versa) and gives us a single-number summary of overall performance.

But it doesn’t say anything about clutch, except that when a player wins with a low DR, we can infer that he outperformed in the big moments.

To get a similarly balanced view of high-leverage performance, we can adapt leverage ratio to equally weight clutch play on serve and return points. I’ll call that balanced leverage ratio (BLR), which is simply the average of LR on serve points and LR on return points. BLR usually doesn’t differ much from LR, just as we often get the same information from DR that we get from total points won. Djokovic’s Wimbledon final BLR was 1.11, compared to a LR of 1.10. But in cases where a disproportionate number of points occur on one player’s racket, BLR provides a necessary correction.

Leverage-adjusted DR

We can capture leverage-adjusted performance by simply multiplying these two numbers. For example, let’s take Stan Wawrinka’s defeat of Djokovic in the 2016 US Open final. Wawrinka’s DR was 0.90, better than Djokovic at Wimbledon this year but rarely good enough to win. But win he did, thanks to a BLR of 1.33, one of the highest recorded in a major final. The product of Wawrinka’s DR and his BLR–let’s call the result DR+–is 1.20. That number can be interpreted on the same scale as “regular” DR, where 1.2 is often a close victory if not a truly nail-biting one. DR+ combines a measure of how many points a player won with a measure of how well-timed those points were.

Out of 167 men’s slam finals in the Match Charting Project dataset, 14 of the winners emerged triumphant despite a “regular” DR below 1.0. In every case, the winner’s BLR was higher than 1.1. And in 13 of the 14 instances, the strength of the winner’s BLR was enough to “cancel out” the weakness of his DR, in the sense that his DR+ was above 1.0. Here are those matches, sorted by DR+:

Year  Major            Winner              DR   BLR   DR+  
2019  Wimbledon        Novak Djokovic    0.87  1.11  0.97  
1982  Wimbledon        Jimmy Connors     0.88  1.20  1.06  
2001  Wimbledon        Goran Ivanisevic  0.95  1.16  1.10  
2008  Wimbledon        Rafael Nadal      0.98  1.13  1.10  
2009  Australian Open  Rafael Nadal      0.99  1.13  1.12  
1981  Wimbledon        John McEnroe      0.99  1.16  1.15  
1992  Wimbledon        Andre Agassi      0.97  1.19  1.16  
1989  US Open          Boris Becker      0.96  1.22  1.18  
1988  US Open          Mats Wilander     0.98  1.21  1.18  
2015  US Open          Novak Djokovic    0.98  1.21  1.18  
2016  US Open          Stan Wawrinka     0.90  1.33  1.20  
1999  Roland Garros    Andre Agassi      0.98  1.25  1.23  
1990  Roland Garros    Andres Gomez      0.94  1.34  1.26  
1991  Australian Open  Boris Becker      0.99  1.30  1.29

167 slam finals, and Djokovic-Federer XLVIII was the first one in which the player with the lower DR+ ended up the winner. (Some of the unlisted champions had subpar leverage ratios and thus DR+ figures lower than their DRs, but none ended up below the 1.0 mark.) While Federer was weaker in the clutch–notably in tiebreaks and when he held match points–his overall performance in high-leverage situations wasn’t as awful as those few memorable moments would suggest. More often than not, a player who combined Federer’s DR of 1.14 with his BLR of 0.90 would conclude the Wimbledon fortnight dancing with the Ladies’ champion.

Surprisingly, 1-out-of-167 might understate the rarity of a winner with a DR+ below 1.0. Only one other best-of-five match in the Match Charting Project database (out of more than 700 in total) fits the bill. That’s the controversial 2019 Australian Open fourth-rounder between Kei Nishikori and Pablo Carreno Busta. Nishikori won with a 1.06 DR, but his BLR was a relatively weak 0.91, resulting in a DR+ of 0.97. Like the Wimbledon final, that Melbourne clash could have gone either way. Carreno Busta may have been unlucky with more than just the chair umpire’s judgments.

What does it all mean?

We knew that the Wimbledon final was close–now we have more numbers to show us how close it was. We knew that Djokovic played better when it mattered, and now we have more context that indicates how much better he was, which is not a unusually wide margin. Federer has won five of his slams despite title-match BLRs below 1.0, and two others with DRs below 1.14. He’s never won a slam with a DR+ of 1.03 or lower, but then again, there had never before been a major final that DR+ judged to be that close. Roger is no one’s idea of a clutch master, but he isn’t that bad. He just should’ve saved a couple of doses of second-set dominance for more important junctures later on.

If you’re anything like me, you’ll read this far and be left with many more questions. I’ve started looking at several, and hope to write more in this vein soon. Is Federer usually less clutch than average? (Yes.) Is Djokovic that much better? (Yes.) How about Nadal? (Also better.) Is Nadal really better, or do his leverage numbers just look good because important points are more likely to happen in the ad court? (No, he really is better.) Does Djokovic have Federer’s number? (Not really, unless you mean his mobile number. Then yes.) Did everything change after Djokovic hit that return? (No.)

There are many interesting related topics beyond the big three, as well. I started writing about leverage for subsets of matches a few years ago, prompted by another match–the 2016 Wimbledon Federer-Raonic semi-final–in which Roger got outplayed when it mattered. Just as we can look at average leverage for points won and lost, we can also estimate the importance of points in which a player struck an ace, hit a backhand unforced error, or chose to approach the net.

Matches are decided by a combination of overall performance and high-leverage play. Commonly-available stats do a pretty good job at the former, and fail to shine much light on the latter. The clutch part of the equation is often left to the speculation of pundits. As we build out a more complete dataset and have access to more and more point-by-point data (and thus leverage numbers for each point and match), we can close the gap, enabling us to better quantify the degree to which situational performance affects every player’s bottom line.

Nick Kyrgios Really Is Different Under Pressure

Italian translation at settesei.it

Earlier this week, we looked at whether Nick Kyrgios is unusually inconsistent. That is, is he more likely to upset higher-ranked players and lose to lower-ranked players than his peers? The numbers say he isn’t.

But that isn’t all we mean when we talk about Kyrgios’s unreliability. He often undergoes dramatic shifts within matches. At times, he is visibly distracted; during his Delray Beach match against Radu Albot, he even shouted that he wanted to get off the court. Other times, he comes up with breathtaking serving and shotmaking at the most crucial moments. He seems motivated by both packed grandstands and on-court pressure. Unfortunately, both of those are missing from a lot of professional tennis.

We already have some evidence for the better-under-pressure hypothesis. In his five matches in Acapulco last week, he won a mere 50.4% of points, one of the lowest totals ever for a title-winner. In three of the five matches, he won return points at a lower rate this opponent, resulting in Dominance Ratios (DRs) below 1.0. Winning a match with a sub-1.0 DR (or fewer than 50% of total points won) isn’t unheard of, but it’s not a reliable way to rise to the top of the sport. Such contests are called “lottery matches” for a reason–there’s a lot of luck involved in winning with such fine margins, and fortune tends to even out.

Yet Kyrgios’s “luck” keeps nudging his results in the same direction. He has played 15 career tour-level matches in which his DR is between 0.9 and 0.99–close matches in which he was slightly outplayed, at least in the points column. With stats like that, players tend to win about one-third of the time. Kyrgios, however, has won eleven of those 15 matches. His good fortune doesn’t cancel out when he narrowly edges out an opponent: In 13 matches with DRs between 1.0 and 1.1, he has lost only two. The Australian is doing something right.

Big points are big

You probably already know what’s going on here, even if you haven’t listened to commentators speculate during Nick’s matches. The key to such narrow victories is converting the “big” points–break points, deuces, tiebreaks, and so on. It doesn’t matter if you throw away a point or two when serving at 40-love. Other situations have considerably more leverage, and that’s when Kyrgios brings his best tennis.

I tallied up Kyrgios’s return points won over the course of his career, based on the point score of each one. (I don’t have the point-by-point sequence of every one of his tour-level matches, but most of them are included, more than enough to constitute a reliable sample.) Here are the five games scores when he wins the most return points, starting with the most effective:

  • 0-40, 40-AD, 15-30, 30-40, 40-40

And the five scores, again in order, starting with least effective:

  • 30-0, 40-0, 40-15, 0-15, 0-0

In other words, when he has a chance to break, he’s great. In my sample of matches, he won 31.5% of return points; when the opposing server is facing him at 0-40, he wins the point 45.0% of the time. At 40-AD, it’s 41.9%. When his opponent serves with a 30-0 advantage, Kyrgios wins a mere 27.3% of return points.

Everybody does it (a little)

Astute readers will realize that I haven’t accounted for a key variable. In a data set of dozens of matches, scores that favor the returner will occur more often against weaker servers. Kyrgios didn’t get many 0-40 or even 40-AD chances against John Isner last week, but he can expect to get more against the likes of Albot. So to some extent, we should expect players to win more return points at these moments. In the last 52 weeks, ATPers have won 37.3% of return points, but 40.1% of break points.

Everybody does it, but Nick does it more. The following table shows the ratio of return points won at each game score to average return points won. The middle column shows Kyrgios’s ratios and the right-most column shows the 2018 ATP tour average:

Situation       NK   ATP  
0-40          1.43  1.14  
40-AD         1.33  1.09  
15-30         1.27  1.05  
30-40         1.26  1.06  
40-40         1.16  1.02  
15-40         1.13  1.06  
15-15         1.11  0.99  
15-0          1.11  0.98  
30-15         1.09  1.00

Situation       NK   ATP  
0-30          1.07  1.06 
AD-40         1.06  1.02  
40-30         1.05  1.00  
30-30         1.03  1.01  
0-0           1.02  0.99  
0-15          1.01  1.05  
40-15         0.95  0.92  
40-0          0.91  0.87  
30-0          0.87  0.91

Most players take advantage in 0-40 situations, and to a lesser extent at break points, but Kyrgios is on another planet. The average player wins roughly 10% more return points in break situations; Kyrgios triples the ratio.

Leverage

We’ve taken a big step toward explaining Kyrgios’s pattern-breaking results and his in-match inconsistency. But even game scores don’t tell the whole story. A deuce point at 5-0 usually matters a great deal more than a break point when the returner is already up a set and a break.

To account for those differences, we’ll turn to the leverage metric. (You’ll also see it referred to as “volatility” or “importance.”) Here’s the idea: Given what we know about two players, we can calculate the probability that one of them will win the match, based on the current situation. If the server wins, that probability shifts in his favor. If the returner wins, it shifts in the opposite direction. Leverage is the sum of those two shifts: the amount of win probability that is at stake at any given point.

For today’s purposes, there are no specific numbers; you need only to understand the concept. The higher the leverage, the more the point matters. Players might disagree with some of the details that a purely math-based approach spits out, but for the most part, the equations capture our intuition about which points matter, and how much.

I calculated the leverage for every point of the 2018 ATP season and split the points into ten categories, from least important (1) to most important (10). The following graph shows the tour average rate of return points won (RPW) for each of those ten categories:

If we ignore the leftmost and rightmost data points, there’s something of a trend here. From the second-to-least-important category to the second-to-most-important, players increase their return points won from about 36.0% to 37.5%. Some of that shift can be explained by a phenomenon I’ve already mentioned: returners find themselves in crucial situations (such as break points) more often against weaker servers.

Here’s the same graph, now with a second line showing Kyrgios’s RPW in the ten categories, from least important to most important. I’ve kept the ATP average trendline for comparison:

Remember that 36.0% to 37.5% increase I mentioned a minute ago? For Kyrgios, the same shift is 27.0% to 35.2%–eight percentage points instead of less than two. It appears that the Australian is extremely sensitive to what’s at stake throughout matches, and when the rewards are high enough, he turns into a credible returner.

Some of you are probably thinking, “of course, I knew that all along.” First of all, I hate it when people say that, because what they really mean is, “I suspected that all along,” and they didn’t really know. Some of the other things such people “know” are actually wrong.

Second, I need to underline just how unusual this is. I’ve been playing around with point-by-point data for a few years now, looking for in-match patterns, for specific players and for the sport overall. Such patterns exist: points and games aren’t entirely independent of each other. But usually they are minor–a percentage point or two, not the kind of thing you could spot even in a fortnight’s worth of matches. Kyrgios breaks the mold. When it comes to the mercurial Australian, the assumptions that are adequate to account for most of professional tennis simply fail.

A Closer Look at Tiebreak Tactics

Italian translation at settesei.it

In theory, tiebreaks are a showcase for big serving, the skill that generates enough holds of serve to push a set to 6-6. But no matter how two players get there, the tiebreak itself doesn’t always work out that way.

Two examples suffice from Wednesday’s Australian Open action. Roger Federer’s second-round match against Daniel Evans opened with twelve straight service holds, threatened by only one break point. Yet in the tiebreak, which Federer won 7-5, the returner claimed 9 of 12 points. Across the grounds in front of a much smaller crowd, Thomas Fabbiano and Reilly Opelka forced a fifth-set super-tiebreak. Through 52 games and 319 points, Opelka hit 67 aces and the pair averaged 2.9 shots per “rally.” In the match-deciding tiebreak, Opelka hit no aces, Fabbiano got all but one of his serves back in play, and they averaged 5.5 shots per point.

When I started researching tiebreaks several years ago, I found that the balance of power shifts away from the server: returners win more points in tiebreaks than at other points during the set. It’s not a huge effect, accounting for about a 6% drop in server winning percentage, possibly due to the fact that players almost always give 100% on each point, unlike weak returners facing 40-0 in the middle of the set. Sure, Federer-Evans and Fabbiano-Opelka are outliers: even if servers suffer a bit in the typical tiebreak, the whole sport doesn’t usually turn upside down. Still, the effect is worth a deeper dive.

Isner isn’t the only conservative

Let’s start with some overall trends. Filtering for men’s matches from 2010-19, I found 831 tiebreaks with shot-by-shot data from the Match Charting Project. For each set that ended in a tiebreak, I tallied several stats for both tiebreak points and non-tiebreak points, calculated the single-set ratio for each stat, and then aggregated all 831 breakers to get some tour-wide numbers. Here’s what happens to stats in tiebreaks:

  • Service points won: -6.5%
  • Aces: -6.1%
  • First serve in: +1.3%
  • Returns in play: +8.5%
  • Rally length: +18.9%

(Technical note: When aggregating the ratios from all 831 tiebreaks, I weighted by the number of points in each tiebreak, but only up to a maximum of 11. Longer tiebreaks tend to be the ones if which servers are the strongest, like the 17-15 marathon in the first set of Fabbiano-Opelka. If those were weighted for their true length, we’d bias the results towards the best serving performances.)

Judging by the increase in successful first offerings, it looks like servers are a bit more conservative in tiebreaks. The large drop in aces and even bigger increase in returns in play provide additional evidence. Focused returners may be able to erase a small number of aces, but not that many, and they wouldn’t be able to convert so many into successful returns. The nearly 20% increase in rally length can be explained in part by the drop in aces (those one-shot rallies are replaced with more-shot exchanges), but the magnitude of the rally length effect suggests that players are more conservative on both sides of the ball.

More than one way

Not every player handles breakers the same way. Several men, including Federer, serve about as well as usual in these high-pressure situations. Certain others, like Rafael Nadal, appear to be more conservative, but make up for it by feasting on the toned-down offerings of opposing servers. Still others, like the impossible-to-write-about-tiebreaks-without-bringing-up Ivo Karlovic, underperform on both sides of the ball.

Here are the 20 players with the most tiebreaks recorded by the Match Charting Project since 2010. For each one, you can see how their rates of service points and return points won in tiebreaks compare to non-tiebreak situations. For instance, Jo Wilfried Tsonga wins 5.4% more service points in tiebreaks than otherwise, compared to the usual shift of 6.5% in the opposite direction. But Tsonga’s rate of return points won falls 3.4%, while the typical player increases his haul on return by 6.5%.

Player                    SPW    RPW  
Jo Wilfried Tsonga       5.4%  -3.4%  
Roger Federer            0.4%   3.2%  
Stan Wawrinka           -0.1%   4.2%  
John Isner              -0.6%   6.4%  
Novak Djokovic          -0.8%  11.8%  
Andy Murray             -2.2%   8.7%  
Alexander Zverev        -2.7%  18.7%  
Juan Martin del Potro   -3.3%   5.3%  
Nick Kyrgios            -4.1%  10.5%  
Dominic Thiem           -4.6%  12.1%  
----ATP AVERAGE----     -6.5%   6.5%  
Kevin Anderson          -7.1%   8.9%  
Gilles Simon            -8.0%  16.3%  
Tomas Berdych           -8.4%   6.8%  
Milos Raonic            -9.2%   9.1%  
Rafael Nadal            -9.4%  13.6%  
Marin Cilic            -10.2%   5.8%  
Bernard Tomic          -11.3%   4.5%  
Ivo Karlovic           -12.6%  -0.9%  
Grigor Dimitrov        -13.8%   5.1%  
Karen Khachanov        -25.1%  -5.4%

For most players, the goal appears to be to win enough extra return points to counteract the drop in service success. Nadal is the most extreme example, winning almost 10% fewer service points than usual, but doing even more damage to his opponents. Alexander Zverev is the most impressive of the bunch, dropping his serve level only a bit, while converting himself into a Rafa-like returner. As you might expect, his tiebreak record is outstanding, winning far more than expected last season. We’ll see whether his eye-popping numbers persist.

A winning strategy

Ideally, I would wrap up a post like this with a recommendation. You know, analyzing the various approaches, based on these numbers, we can confidently say that players should….

It’s not that easy. It’s hard enough to identify which players are good at tiebreaks, let alone why. As I’ve written many times before, tiebreak results are closely related to overall tennis-playing skill, but not to serving prowess or excellence in the clutch. In any given season, some players amass outstanding tiebreak records, but their success one year rarely translates to the next. At various times in the past, I’ve highlighted Federer, Isner, Nadal, and Andy Murray as players who defy the odds and consistently outperform expectations in tiebreaks, but even they don’t always manage it. Isner, the poster boy for triumph via tiebreak, won slightly fewer breakers than expected in both 2016 and 2018.

Still, let’s look at these four guys in the light of the shot-by-shot data I’ve shared so far. Federer, Isner, and Murray are in the minority of players who hit more aces in tiebreaks than otherwise. However, it it doesn’t necessarily mean they are much more aggressive; of the the three, only Federer makes fewer first serves than usual. Isner manages to reduce the number of returns in play by 10%, compared to non-tiebreak situations, while the other two do not. Nadal breaks the mold entirely, making 6% more first serves than usual and hitting barely half as many aces.

In other words, there’s no single path to success. Federer and Isner maintain their superlative serving while taking advantage of their opponents’ nerves or conservative tactics. (I’ve previously suggested that the difference in serve points won comes from players like Isner upping their return game in pressure situations. He does, but not any more than the average player.) Nadal plays to his own strengths, forcing players into rallies from both sides of the ball. There may be some quality that ties these four men together (like focus), but we’re not going to find it here.

The Effect of Tiebreak Luck

I’ve written several things over the years about players who win more or fewer tiebreaks than expected. (Interested readers should start here.) Fans and commentators tend to think that certain players are particularly good or bad at tiebreaks. For instance, they might explain that a big serve is uncommonly valuable at the end of a set, or that mental weakness is more harmful than ever at such times.

My research has shown that, for the vast majority of players, tiebreak results are indistinguishable from luck. Let me qualify that just a bit: Tiebreak results are dependent on each player’s overall skill, so better players tend to win more tiebreaks. But there’s no additional factor to consider. While players tend to win service points at a slightly lower rate in tiebreaks, the effect is similar for everyone. There’s no magical tiebreak factor.

However, a single season is short enough that some players will always have glittering tiebreak records, tricking us into thinking that they have some special skill. In 2017, John Isner won 42 of his 68 tiebreaks, a 62% success rate. Based on his rate of service points won and return points won against the opponents he faced in tiebreaks, we’d expect him to win only 34–exactly half. Whether by skill or by luck, he exceeded expectations by 8 tiebreaks. Armed with a monster serve and a steady emotional presence on court, Isner is the kind of guy who makes us think that he has hacked the game of tennis, that he has figured out how to win tiebreaks. But while he has beaten expectations several times throughout his career, even Big John can’t sustain such a level. In 2018, he played 73 tiebreaks, and the simple model predicts that he would win 41. He managed only 39.

For additional examples, name whichever player you’d like. Roger Federer has built a career on unshakeable service performances, yet his tiebreak performances have been roughly neutral for the last four years. In other words, he wins tiebreak serve and return points at almost exactly the same rate as he does non-tiebreak points. Robin Haase, infamous for his record streak of 17 consecutive tiebreak losses, has paralleled Federer’s tiebreak performance for the last four years. 2018 was particuarly good for his high-pressure record, as he won two more breakers than expected, putting him in the top quartile of ATP players for the season.

Meaning from randomness

In short, season-by-season tiebreak performance resembles a spreadsheet full of random numbers. A player with a good tiebreak record last year may well sustain it this year, but only if it’s based on good overall play. If there is an additional secret to tiebreak excellence (beyond being good at tennis), no one has told the players about it.

But in sports statistics, every negative result has a silver lining. We might be disappointed if a stat is not predictive of future results. However, the very lack of predictiveness allows us to make a different kind of prediction. If a player has a great tiebreak year, beating expectations in that category, the odds are he just got lucky. Therefore, he’s probably not going to get similarly lucky this year, and his overall record will regress accordingly.

The player to watch in 2019 in this department is Taylor Fritz, who recorded a sterling 20-8 record in tiebreaks last season. Based on his performance in the whole of those matches, we would have expected him to win only 13 of 28. His Tiebreaks Over Expectations (TBOE) of +7 exceeded that of any other tour player last season, even though many of his peers contested far more breakers. It’s always possible that Fritz really does have the magical mix of steely nerves and impeccable tactics that translates into tiebreak wins, but it’s far more likely that he’ll post a neutral tiebreak record in 2019. In 2017, the player after Isner on the TBOE list was Jack Sock, and it’s fair to say that his 2018 campaign didn’t exactly continue in the same vein.

With that regression to the mean in mind, here are the TBOE leaders and laggards from the 2018 ATP season. The TBExp column shows the number of tiebreaks that the simple model would have predicted, and TBOR is a rate-stat version of TBOE, reflecting the percentage of tiebreaks won above or below average. Rate stats like TBOR are usually more valuable than counting stats like TBOE, but in this case the counting stat may have more to tell us, since it takes into account which players contest the most tiebreaks. Sam Querrey’s rate of underperformance isn’t quite as bad as Cameron Norrie’s, but the number of tiebreaks he plays is a result of his game style, justifying his place at the bottom of this list.

Player                 TBs  TBWon  TBExp  TBOE   TBOR  
Taylor Fritz            28     20   13.3   6.7   0.24  
Bradley Klahn           22     16   10.6   5.4   0.24  
Martin Klizan           16     13    8.1   4.9   0.31  
Kei Nishikori           22     17   12.5   4.5   0.20  
Bernard Tomic           18     14    9.6   4.4   0.24  
Alexander Zverev        23     17   13.2   3.8   0.17  
Albert Ramos            22     15   11.2   3.8   0.17  
Adrian Mannarino        25     16   12.3   3.7   0.15  
Stan Wawrinka           21     13    9.6   3.4   0.16  
Juan Martin Del Potro   32     22   18.7   3.3   0.10  
                                                       
Borna Coric             21      8   10.8  -2.8  -0.13  
Denis Shapovalov        30     12   15.0  -3.0  -0.10  
Karen Khachanov         42     20   23.4  -3.4  -0.08  
Ivo Karlovic            47     19   22.6  -3.6  -0.08  
Denis Istomin           31     13   16.7  -3.7  -0.12  
Ricardas Berankis       22      7   10.9  -3.9  -0.18  
Pablo Cuevas            21      7   11.3  -4.3  -0.20  
Andrey Rublev           18      5    9.6  -4.6  -0.26  
Fernando Verdasco       25      8   12.8  -4.8  -0.19  
Roberto Bautista Agut   26     10   14.8  -4.8  -0.19  
Cameron Norrie          22      5    9.9  -4.9  -0.22  
Sam Querrey             36     12   18.5  -6.5  -0.18

The guys at the top of this list can expect to see their tiebreak records drift back to normalcy in 2019, while the guys at the bottom have reason to hope for an improvement in their overall results this year.

Converting tiebreaks to wins

I’m sure we all agree that tiebreaks are really important, but what’s the real impact of the over- and underperformance I’m talking about here? In other words, given that Kei Nishikori won 4.5 more tiebreaks last season than expected (than he “should” have won), how did that effect his overall won-loss record? And by extension, what might it mean for his match record in 2019?

The math gets hairy*, but in the end, two additional tiebreak wins are roughly equal to one additional match win. Nishikori’s 4.5 bonus tiebreaks are equivalent to about 2.25 additional match wins. He was 48-22 last year, so with neutral tiebreak luck, he would’ve gone 46-24. Of course, that still leaves some unanswered questions; translating match record to ranking points and titles is much messier, and I won’t attempt anything of the sort. His lucky tiebreaks might have converted should-have-been-losses into wins, or they might have turned gut-busting three-setters into more routine straight-set victories. But blending all the possibilities together, each player’s TBOE has a concrete value we can convert to wins.

The exact numbers aren’t important here, but the concept is. When you see an extremely good or bad tiebreak record, you don’t need to whip out a spreadsheet and calculate the precise number of breakers the player should have won. Given neutral luck, every ATP regular should have a tiebreak record between 40% and 60%–40% for the guys at the fringe, 60% for the elites. (In 2018, Federer’s expected rate was 60.1%, and Sock’s was 40.9%.) Any number out of that range, like Richard Gasquet’s 13-of-16 in 2016, is bound to come crashing back to earth, though rarely so catastrophically as the Frenchman’s did, falling to a mere 5 wins in 17 tries.

Any given tiebreak might be determined by superlative serving, daring return tactics, or sheer mental fortitude. But over time, those effects even out, meaning that no player is consistently good or bad in breakers. The better player is more likely to win, but luck has a huge say in the outcome. In the long term, that luck usually cancels itself out.

* A quick overview of the math: In a best-of-three match, there are three possible times that the tiebreak can take place. Flipping the result of a tiebreak could change the result of the first set, the second set, or the third set. The win probability impact of flipping the first set is 50%–assuming equal players, the winner has a 75% chance of winning the match and the loser has a 25% chance. The win probability effect of reversing the second set is also 50%. Either the winner takes the match (100%) instead of forcing a third set (50%), or the winner forces a third set (50%) instead of losing the match (0%). Changing the result of the third set directly flips the outcome of the match, so the win probability effect is 100%.

Every completed match has a first and second set, but fewer than 40% of ATP matches have third sets. The weighted average of 50%, 50%, and 100% is about 58%, which would be our answer if ATPers played only best-of-three matches. The math for five-setters is more involved, but the most important thing is that best-of-five gives each of the first four sets less leverage, and by extension, it does the same to tiebreaks in the first four sets. Weighing that effect combined with the frequency of best-of-five set matches would give us a precise value to convert TBOE to wins. Rather than going further down that rabbit hole, I’m happy with the user-friendly andapproximately correct figure of 50%.