Also today: The odds of a 42-point tiebreak; January 19, 1974
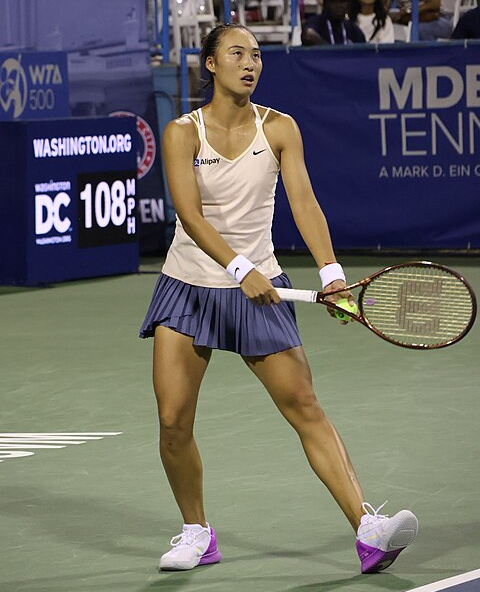
Qinwen Zheng is one of the top prospects in the women’s game, up to 14th on the WTA ranking list at age 21. She won her first tour-level title in Palermo last summer, then upset Ons Jabeur en route to a quarter-final showing at the US Open. After topping Barbora Krejcikova for a second title in Zhengzhou, she reached the final at the WTA Elite Trophy, falling in a two hour, 52-minute final to Beatriz Haddad Maia.
With yesterday’s upsets of Elena Rybakina and Jessica Pegula at the Australian Open, Zheng’s draw opened up. With only one other seed in the second quarter, she’s the heavy favorite to earn a semi-final date with Iga Swiatek. Potential is poised to become reality.
It’s never been difficult to dream big on the Chinese woman’s behalf. Her service motion–once she gets past a hitchy toss–is a photographer’s dream, and she takes advantage of her five-foot, ten-inch frame to send first serve after first serve into the corners. When she hits a target out wide, returners are lucky to get a racket on the ball, let alone put it back in play. Her forehand is equally powerful.
The results bear out the devastation wreaked by her first delivery. Here are last year’s WTA top ten in first-serve percentage:
Player               1stWon%
Qinwen Zheng           73.7%
Elena Rybakina         73.6%
Aryna Sabalenka        72.8%
Caroline Garcia        72.5%
Liudmila Samsonova     71.5%
Iga Swiatek            70.0%
Petra Kvitova          69.8%
Belinda Bencic         69.5%
Petra Martic           69.5%
Ekaterina Alexandrova  69.4%
Pretty good company, huh? Her forehand grades well, too. According to Match Charting Data, Zheng hits more winners, induces more forced errors, and commits fewer unforced errors with that shot than the average player on tour. Her forehand potency (FHP) per match over the last 52 weeks is 10.8, placing her in the top ten among tour regulars, just behind Haddad Maia and Madison Keys.
That’s the good news. If you’re going to have just two world-class weapons, those are the ones to pick. They’ve served her well so far: If she justifies her seed and reaches the final four in Melbourne, she could crack the top ten.
The rest of Zheng’s game is–let’s be optimistic here–a work in progress. Today I want to look specifically at her serve as a whole; we’ll save her not-as-problematic backhand for another day.
When the 21-year-old lands her first serve, as we’ve seen, good things happen. She hits more aces than almost anyone on tour, and about half of her first-serve points end with either an unreturned first serve or a plus-one winner. The problem is, she doesn’t make many first serves, and when she misses, her second serve is as erratic as her first serve is imposing.
The average top-50 player on the WTA tour makes about 62% of her first serves. In 2023, Zheng succeeded just 51.8% of the time, almost three full percentage points below anyone else.
Making matters worse, her second-serve results are nearly as bad. The average top-50 WTAer wins 47% of her second-serve points. Zheng won 45.5%, a mark that places her in the bottom third of that group. Among the current top 20, only Jelena Ostapenko and Daria Kasatkina win fewer second-serve points. It’s even worse against a strong opponent. She hung onto just 20% of second-serve points against Swiatek in the United Cup this month, 24% versus Rybakina in Beijing, and a mere 26% against Liudmila Samsonova in Montreal. Zheng’s primary weapon makes her look like an elite server, but the overall picture is more mundane. Her first serve sets her on a level with Rybakina, but she barely holds serve as often as Petra Martic.
What is to be done?
This seems like it should be fixable, especially in so young a player. It’s certainly easy to dream. Imagine the seemingly-modest scenario in which Zheng manages to land her first serves and win second-serve points at the rates of an average top-50 player while maintaining her dominance on firsts. She would then win 63.5% of her service points. Only Swiatek and Sabalenka do better.
Easier said than done, of course. A good first serve is no guarantee of a strong second. On the women’s tour, there almost zero correlation between first-serve and second-points won.
Still, this seems like partly a tactical failure, not entirely a gap in her skillset. If Zheng can win nearly 74% of her first-serve points when she misses almost half of the time, what would happen if she served a bit more conservatively? Perhaps she could make 57% of her first serves and still win 72% of them? If so, that would be a bit better. Could she make 62% of first serves–the tour average rate–and win 70% of them? That would be better still.
Once we assume that these tradeoffs are feasible, the whole thing starts to sound like less of a tactical question and more of a pure math problem. I’m not sure that it is: Players practice various types of “first serves” and “second serves,” not every theoretical delivery on the continuum between them. Maybe a thoughtful veteran could tweak things to increase or decrease her first-in percentage at will, but I’m skeptical that a young player could do th esame. At the very least, it’s a project that would take some time.
Still, it’s worth working out whether Zheng could get more bang for her serve-talent buck. In 2009, Dutch researchers Franc Klaassen and Jan R. Magnus (henceforth K&M) published a paper in the Journal of Econometrics that proposed to answer this sort of question. They worked out the usual relationship between serving risk (how many first serves in, how many double faults) and reward (rate of first- and second-serve points won). My friend Jeff McFarland converted their rather complex algorithm to a spreadsheet, which is why I’m able to publish this today, and not in March. Thanks Jeff!
The following table shows Zheng’s actual 2023 results along with her model-optimized rates:
         1stIn%  1stWon%    DF%  2ndWon%   SPW%
Actual    51.8%    73.7%   6.0%    45.5%  60.1%
Optimal   60.5%    70.9%   8.8%    47.5%  61.7%
K&M’s formula estimates that Zheng could get close to a tour-average level of first serves in and still win about 71% of them, a success rate that would keep her in the top five. The more surprising output is that she could do better by taking more chances on her second serve. (This is a kind of light version of the oft-discussed argument that a player should just hit two first serves. The algorithm recommends some degree of this for most pros.) By adopting the more risky second-serve approach, she would in theory win 47.5% of those points despite the increase in double faults.
Altogether, those changes would increase her total service points won from 60.1%–12th among the current top 50–to 61.7%, which would rank her fifth.
Another way of looking at the potential gain is in points per thousand. For every thousand service points played, the fully-optimized version of Zheng would win about 16 more than she does now. If her return game remained the same, that’s an improvement of eight points per thousand overall. A few years ago I stumbled on a neat rule of thumb, that an improvement of one point per thousand translates into a gain of one place in the rankings, except near the very top. If that held in this case, the re-imagined Zheng would be on the cusp on the top five.
Again, this is all theoretical. I have no idea whether a big server could consciously execute a decision to take slightly fewer chances on the first and more on the second, or whether her results would follow the model if she did.
But! This is a potential route to a jump up the rankings without reworking groundstrokes, getting fitter or stronger, or even gaining experience. It’s probably not easy, but it’s likely simpler than the alternatives. As it stands now, Zheng’s second serve–and the frequency she’s forced to hit it–is going to hold her back. Solve that problem, and much of her obvious potential is unlocked.
* * *
The odds of a 42-point tiebreak
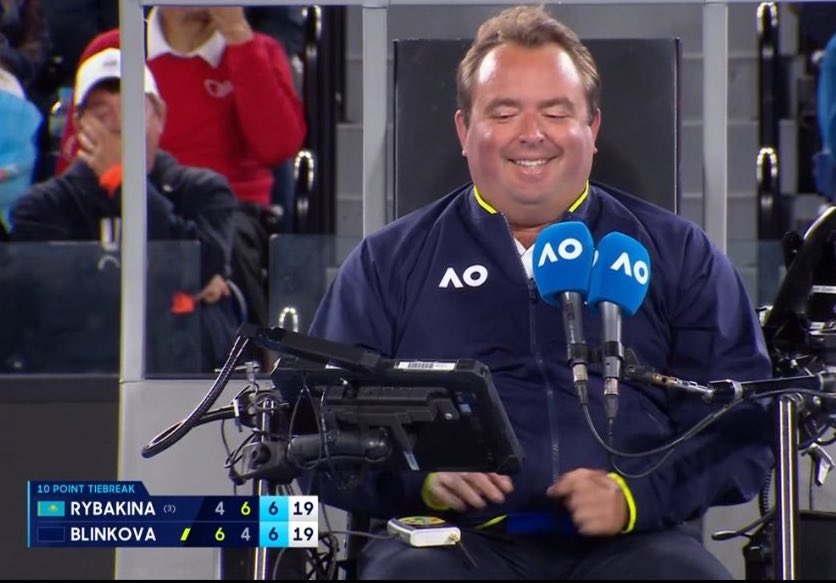
Yesterday, Elena Rybakina and Anna Blinkova played a 42-point tiebreak. It’s the longest breaker in grand slam singles history. Blinkova won it, 22-20.
What are the odds?
Let’s start with simply getting to 9-all. We’ll assume that Rybakina and Blinkova were playing at the same level. Yes, Rybakina was a heavy favorite entering the match, and she won a few more points than Blinkova to get to 6-4, 4-6, 6-all. But the margin was narrow, and the math is simpler if we assume they are equal. They won serve points throughout the match at about a 59% rate. Since players tend to be more conservative during tiebreaks, returners fare better, so we’ll say that whoever is serving had a 55% chance of winning the point.
I ran a Monte Carlo simulation to find the odds of reaching 9-all. Here are those probabilities, along with odds at various other levels of serve dominance:
SPW   Reach 9-all
55%         10.0%
60%         10.3%
65%         11.2%
70%         12.5%
80%         17.0%
Roughly speaking, there was a one-in-ten chance that yesterday’s breaker would reach 9-all.
From there, the math is simpler. There are two ways to get from 9-all to 10-all: both women could win their service points, or both could win their return points. Serving at 55%, the chances that one or the other occurs are 50.5%. The same logic applies to the step from 10-all to 11-all, 11-all to 12-all, and so on. So for Rybakina and Blinkova, getting from 9-all to 20-all was roughly equivalent to flipping a coin eleven times and getting heads every time–a one-in-two-thousand shot.
To reach 20-all, then, players need to get to 9-all, then trade points another eleven times. For servers at 55%, that’s a one-in-ten shot followed by a one-in-two-thousand shot, or one in twenty thousand–a 0.005% likelihood–altogether.
Here are the equivalent numbers for servers at various levels:
SPW   Reach 9-all  Reach 20-all  that's 1 in…
55%         10.0%        0.005%         18357
60%         10.3%        0.008%         12916
65%         11.2%        0.014%          7086
70%         12.5%        0.031%          3201
80%         17.0%        0.244%           409
You might remember the 24-22 tiebreak that Reilly Opelka won against John Isner in Dallas a couple of years ago. The probabilities are dramatically different depending on how serve-dominant the players are, so the Rybakina-Blinkova result was considerably more far-fetched than what Opelka and Isner produced. Adjusting for the fact that the Dallas tiebreak was first-to-seven and assuming that both players won 80% of serve points (an estimate on the low side), this method gives us a one-in-2,192 chance of that tiebreak reaching 22-all.
There are various ways to tweak the numbers. It might be the case that players perform better facing match point; if so, it’s a bit more likely that they’d reach this sort of outrageous score. Maybe it’s appropriate to give Rybakina a modest edge over Blinkova; if we did that, the odds of drawing even so long would be lower. One-in-18,357 isn’t exactly right, but it gives us a rough idea of just how unusual yesterday’s feat truly was.
* * *
January 19, 1974: Sanctioned
Four months from its proposed opening day, things finally started to look up for World Team Tennis. On January 18th, the USLTA officially sanctioned the league in exchange for a $144,000 fee. Another chip fell the next day, when American co-number one Jimmy Connors signed with the Baltimore Banners.
WTT still had several hurdles to clear. The British LTA continued to object to the league’s attempted takeover of so many weeks of the summer calendar. The ILTF, as well, had yet to give their okay. The ATP, still a nascent players’ union, also held back. A few top men–John Newcombe, Ken Rosewall, and now Connors–had thrown in their lot with the upstarts, but until the union made its stance clearer, the WTT ranks remained dominated by women stars.
Across the country, those women were making the case that they’d be able to draw sufficient crowds on their own. Also on January 19th, the first event of the 1974 Virginia Slims circuit came to a close. 6,000 fans packed San Francisco’s Civic Auditorium to watch Chris Evert take on Billie Jean King for the title. Another 2,000 were turned away at the gates. Traffic was jammed for blocks in every direction, and ticket scalpers worked the rows of stalled motorists.
The Slims tour had been dominated by Margaret Court in 1973, with Billie Jean hampered by injury and Evert competing on a separate tour sponsored by the USLTA. This year, Court was absent, pregnant with her second child. If San Francisco was any indication, the Australian would hardly be missed. The federation had made peace with the one-time rebels of the Slims tour, and now Gladys Heldman’s women-only circuit was the only game in town. Billie Jean was healthy (and the ultimate marquee draw, after defeating Bobby Riggs), and Evert provided new blood.
Chrissie also provided fresh motivation for the Old Lady. King had hinted that she would dial back her tournament commitments in 1974, but she wasn’t one to back down from a challenge. Playing no-ad games for the San Francisco title, Billie Jean kept her younger opponent under constant pressure. Five times Evert reached sudden-death point on her serve; five times she saved it. King finally pulled ahead to take the first set, winning the tiebreak, 5-2. Evert mounted a comeback from 0-4 in the second, but Billie Jean halted her momentum when she chased down a drop shot that Chris didn’t think she could touch.
“She was very gutsy and I once thought I had no chance,” King said after the match. “And thank God for giving me a pretty good pair of wheels on that particular shot.”
Billie Jean was thrilled at both the result and the sellout crowd. Nothing pleased her more than a successful women’s tour–except, of course, for a successful women’s tour with herself on top.
* * *
Subscribe to the blog to receive each new post by email:
_09.jpg)
.jpg)