Carlos Alcaraz and the Fruits of Shot Tolerance

Carlos Alcaraz making it look easy

Tennis people increasingly talk about “shot tolerance.” What does it mean?

There’s no standard definition. A Google summary settles on this: “a player’s ability to get to and return a given ball as desired.” Other definitions focus more on avoiding unforced errors: How long can a player stay in a rally without making a mistake?

I think of it like defense, in a very broad sense. Usually when we talk about defensive skills, it’s a lunging Andy Murray, recovering balls that nearly end the point, like big serves or would-be winners. In pro tennis, though, nearly every shot has an offensive component. That is to say, almost every shot tests the defensive skill–or resourcefulness, or shot tolerance–of the other player. A heavy Jannik Sinner forehand right at the feet, a Novak Djokovic backhand angled wide: Can you handle that and keep the point alive?

Another way to conceptualize shot tolerance is to imagine a win probability stat that updates with each shot. When Sinner hits that heavy forehand, his chances of winning the point against an average opponent increase to, say, 70%. A player with high shot tolerance will somehow save more than 30% of those points. A player with low shot tolerance will fail to get as many back (or hit weaker replies), and he’ll win fewer than 30% of those points.

We don’t have that all-knowing win probability stat, so we can’t measure shot tolerance so directly. Because the concept is fuzzy, I don’t imagine we’ll land on a fully satisfying way to quantify shot tolerance. But it’s worth the attempt, and it will help us explain how Rotterdam champ Carlos Alcaraz works his magic.

Long rallies

Start with the basics. Players with high shot tolerance should win more long rallies, right?

I drew the line at six shots, including rallies where the sixth stroke was an unforced error. I don’t want to muck things up by mixing surfaces, so we’re sticking with hard courts today. Based on Match Charting Project data, here are the men who have won the most of these “long” rallies on hard courts since the beginning of 2024:

Player            6+ W%  
Jannik Sinner     56.1%  
Carlos Alcaraz    55.6%  
Alex de Minaur    55.1%  
Grigor Dimitrov   55.1%  
Joao Fonseca      55.0%  
Learner Tien      54.5%  
Andrey Rublev     54.2%  
Novak Djokovic    53.7%  
Daniil Medvedev   53.7%  
Alejandro Tabilo  53.2%

The top of the list is as expected: Sinner and Alcaraz can outlast most opponents and have the ability to end the point. Fonseca and Tien probably won’t sustain these numbers, since they haven’t played the same level of competition as the others. Tabilo’s position is dicey, too, as we don’t have as many charted matches of his. Alexander Zverev is next on the list, if you’d like to promote him in Tabilo’s place.

Complicating matters is how these points end. The goal isn’t to sustain the longest rally possible. At some point shot tolerance gives way to power and calculated risk-taking. Some players are particularly strong on the pure shot-tolerance side of things, avoiding unforced errors in these long rallies:

Player            6+ Rally UFE%  
Casper Ruud               15.8%  
Bu Yunchaokete            17.9%  
Lorenzo Musetti           18.5%  
Daniil Medvedev           19.5%  
Alex Michelsen            19.5%  
Frances Tiafoe            20.0%  
Karen Khachanov           20.2%  
Alejandro Tabilo          20.4%  
Learner Tien              20.7%  
Novak Djokovic            21.0%

There’s some overlap between the two lists, but not much. Sinner’s error rate is better than average, at 22.3%, while Alcaraz’s is worse, at 24.1%. In the Rotterdam first round against Botic van de Zandschulp, Alcaraz committed unforced errors on 40% of points that reached the sixth shot. He still somehow won half of the long points.

There’s a relationship between win rate and error rate on long points–there pretty much has to be, since errors are points lost. But error rate explains less than 30% of the variation in long-rally winning percentage. Alcaraz, for one, breaks the mold by committing a lot of errors yet winning the majority of the points:

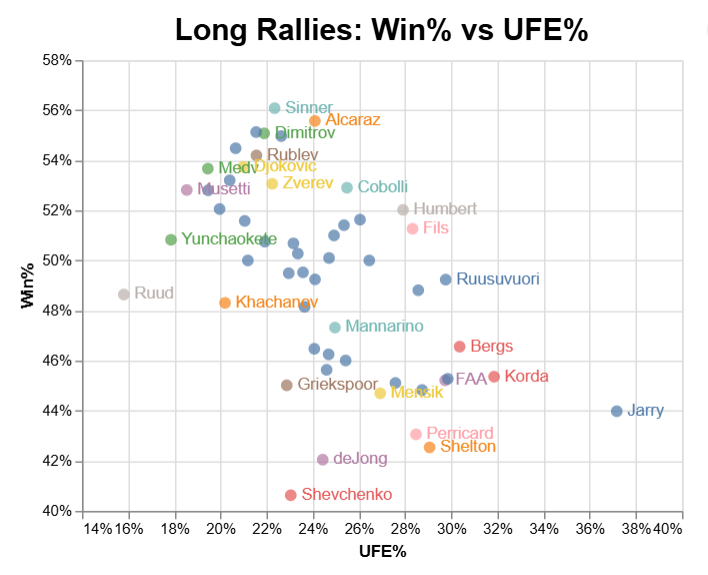
Alcaraz’s errors don’t usually expose a weakness of shot tolerance. They reflect a gamble. (Sinner is similar, though his groundstrokes are so imposing that he can do more damage with less risk.) We can’t just count errors and create a shot-tolerance metric, but we also don’t have the ability to ask players what they were thinking when they attacked every shot. Isolating shot tolerance requires a different approach.

Accepting errors

Let’s shift from points to shots. Again for hard-court matches since the start of last season, I tallied each player’s baseline strokes starting from the fourth shot of each rally. Shot tolerance is useful for serve returns and plus-ones, but those shots are so often out of a player’s control. And since most points are short, returns and plus-ones end up dominating the data. To get a sample of shots that reflect what we think of as “rallying,” we need to discard those.

(The word “baseline” is doing a ton of work here. Shot tolerance isn’t usually about making volleys or smashes, or about executing passing shots. So I’ve excluded every shot at the net, as well as every shot when the opponent is at or approaching the net.)

As with the long rallies, we can start by getting a sense of the shot-tolerant all-stars, the guys who are best at avoiding unforced errors:

Player                UFE/Shot %  
Learner Tien                7.4%  
Alexander Shevchenko        7.9%  
Lorenzo Musetti             8.2%  
Alejandro Tabilo            8.2%  
Tommy Paul                  8.7%  
Frances Tiafoe              8.9%  
Carlos Alcaraz              9.2%  
Jannik Sinner               9.2%  
Matteo Arnaldi              9.2%  
Casper Ruud                 9.7%

Musetti, Paul, and Ruud are names you’d probably expect to see here. Alcaraz and Sinner are more bracing. They don’t stand out as error-avoiders when we look at long rallies, but on a per-shot basis, they do.

In general, there’s a predictable trade-off. Players who hit more winners (and force more errors) commit more unforced errors. But the relationship between the two numbers is not the same for everyone. Here’s the same UFE-top-ten list, with winner rates added:

Player                UFE%  W+FE%  
Learner Tien          7.4%   7.3%  
Alexander Shevchenko  7.9%   9.1%  
Lorenzo Musetti       8.2%   9.1%  
Alejandro Tabilo      8.2%  10.6%  
Tommy Paul            8.7%  11.1%  
Frances Tiafoe        8.9%   8.0%  
Carlos Alcaraz        9.2%  10.1%  
Jannik Sinner         9.2%  14.1%  
Matteo Arnaldi        9.2%   8.3%  
Casper Ruud           9.7%  11.1%

Holy Sinner! The typical ATP regular hits slightly more winners than UFEs at these stages of the rally. Tien, Tiafoe, and Arnaldi are on the wrong side of the scale. Tabilo, again, is probably favored by a limited (and biased) sample. And Sinner … well, you need to go 15 more players down the list before you find anyone who cracks as many winners as he does, and Karen Khachanov coughs up a quarter more errors to accomplish the feat.

Here’s the full scatterplot:

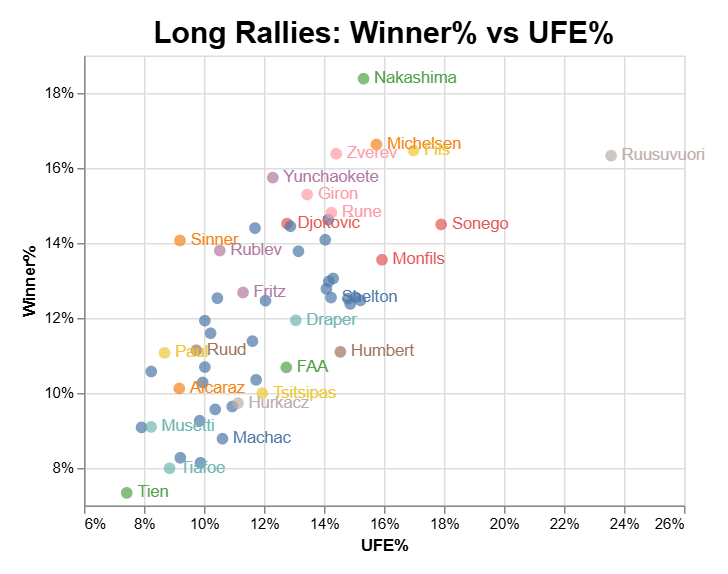
This is a tighter relationship than the one pictured earlier. The player-to-player variation in winner rate explains half of the difference in error rate. Yet again, some players defy the usual tradeoff. The closer they are to the upper left corner of the graph, the more risk-free their aggression.

Controlled (for) aggression

It feels weird to quantify shot tolerance by considering winners, but that’s exactly what we’re going to do.

As a simplification, imagine that we put every shot into one of two categories: aggressive or defensive. Aggressive shots really aren’t about shot tolerance. Unless the aggression is just a last-ditch effort from a hopeless position, it’s a shot that the player more or less knows he can make. He hits hard, aims for the line, and it ends the point one way or the other.

Shot tolerance isn’t about the unforced errors that come from that kind of risk. We’re interested in how steady a player is on every other shot.

To get there, we’re going to string together some assumptions. You’ll probably disagree with some of them, and you’ll almost definitely disagree with some of the results. But bear with me for a minute anyway.

Say that the “cost” of winners (and forced errors) is half as many unforced errors. The usual ratio is closer to 1:1, but that doesn’t count forced errors, and it counts the kind of “bad” errors that come from low shot tolerance. So the 2:1 ratio means that if a player is going to hit two winners, the cost of doing business is one unforced error. For Alcaraz, his 10.1% winner rate implies that even if he’s playing flawlessly in non-aggressive situations, he’ll still have an error rate of about 5%.

From there, we come up with a “non-aggressive” error rate. Since Alcaraz’s total error rate is 9.2% and we’re writing off 5% as the cost of his aggression, that leaves us with 4.2%. We’ll divide that by the number of non-aggressive shots–that is, 100% of his shots, minus his winners, minus the 5% of aggressive errors. So: 4.2% divided by (100% – 10.1% – 5% =) 84.9%. Punch it into the calculator, and we get a non-aggressive error rate of 4.9%.

In more positive terms, that’s a “shot tolerance” of 95.1%. That is, when he has a reasonable chance of making a shot (meaning his opponent didn’t hit a winner or generate a forced error), and he doesn’t go big, he makes the shot 95.1% of the time. Average among tour regulars is 93.7%. Here are the top ten, excluding the names like Tien and Tabilo that I quibbled with above:

Player           ShotTol  
Jannik Sinner      97.3%  
Tommy Paul         96.2%  
Lorenzo Musetti    95.7%  
Andrey Rublev      95.4%  
Carlos Alcaraz     95.1%  
Grigor Dimitrov    95.0%  
Casper Ruud        95.0%  
Daniil Medvedev    94.9%  
Frances Tiafoe     94.5%  
Alex de Minaur     94.4%

So, do you agree that Alex de Minaur doesn’t have the shot tolerance of Rublev, Dimitrov, or Tiafoe? What about leaving Djokovic out of the top ten entirely? (His figure over the last 13 months is a below-average 93%.) Of course you don’t. That’s what I’m here for.

Djokovic is easy enough to explain. His last 13 months have been rocky. If we expand the time frame back to 2020, his number shoots up to 97.1%.

Dimitrov is higher than expected because of his reliance on the slice. Dan Evans did well by this metric, too. Slices are a good way to keep balls in play, even if they don’t generate a lot of offensive opportunities. I hesitate to exclude slices from the metric, but some kind of adjustment is probably in order.

De Minaur may expose another limit of this approach. One of the assumptions I strung together is that everyone’s winners come at the same cost. But the Aussie is relatively small: He can’t just wave a magic wand and generate winners like Sinner can. He needs to take more risks to end points. His winner/error ratio for this set of shots is 10.7% to 10.0%. My model assumes that a bit more than half of his errors are aggressive shots that missed the mark. But what if it’s more? In the bizarro world where players really did register their intention before every shot, we might find that many more of de Minaur’s errors fall in that category.

Or, maybe, he’s not quite as sturdy as we think he is. Either way, it’s something to watch next time you tune into a match of his.

Return to Alcaraz

Why, then, is Carlitos’s name in the headline? Sinner (or Tien, or Ruud) is better by most of these metrics.

What fascinates me about shot tolerance is what it doesn’t explain. If shot tolerance determines anything, it should tell us who’s going to win long rallies. And to some extent it does: Sinner tops the shot tolerance list, and he wins more long rallies than anybody else. (Though that doesn’t prove much: Sinner is better at just about everything, related or not.)

Yet Alcaraz isn’t far behind in long rallies. The Spaniard comes in second with room to spare. Tommy Paul does better on my shot tolerance metric, yet he wins only 51% of long rallies.

The X-factor, I think, is that shot tolerance is instrumental. You can win some points by out-shot-tolerancing your opponent, because yes, eventually they will miss. But nearly as often, you will keep the rally alive, even slightly in your favor, and they’ll take a risk that pays off. If that opponent is Sinner, that’s the most likely outcome. Just ask de Minaur, who has lost all ten of his career meetings with the Italian.

Alcaraz’s long-rally magic doesn’t fully show up in the shot tolerance metric because it isn’t confined to the baseline. The signature Carlitos point is a ten-stroke rally that he puts away at the net or polishes off with a drop shot. His baseline prowess isn’t quite a match for Sinner, and his net skills probably rank behind those of Federer or Nadal. But has there ever been a player who could go from gutbusting rally to all-court acrobatics with such success?

The Spaniard approaches the net half-again as often as Sinner does. He wins nearly three-quarters of points when he does so. In today’s game, a mid-rally net approach has to be earned, and many strong forecourt players don’t have the baseline skills to create those chances.

Shot tolerance, then, is necessary but not sufficient. (And that’s even ignoring short points. Impregnable rallying doesn’t count for much when the serve is unreturnable.) Sinner earns his point-ending chances with sturdy baseline work, then converts them from the same position. Alcaraz is nearly as good at keeping the point alive, and he has more options than anybody when it comes to finishing it.

* * *

Subscribe to the blog to receive each new post by email:


WTA Decisions From the Backhand Corner

Earlier this week I presented a lot of data about what happens when men face a makeable ball hit to their backhand corner. That post was itself a follow-up on a previous look at what happened when players of both genders attempted down-the-line backhands. You don’t need to read those two articles to know what’s going on in this one, but if you’re interested in the topic, you’ll probably find them worthwhile.

Decision-making in the backhand corner is one of the biggest differences between pro men and women. Let me illustrate in the nerdiest way possible, with bug reports from the code I wrote to assemble these numbers. My first stab at the code to aggregate player-by-player numbers for men failed because some men never hit a topspin backhand from the backhand corner. At least, not in any match recorded by the Match Charting Project. The offending player who generated those divide-by-zero errors was Sam Groth. In his handful of charted matches, he relied entirely on the slice, at least in those rare cases where rallies extended beyond the return of serve.

Compare with the bug that slowed me down in preparing this post. The problematic player this time was Evgeniya Rodina. In nine charted matches, she has yet to hit a forehand from the backhand corner. If your backhand is the better shot, why would you run around it? Of the nearly 200 players with five charted matches from the 2010s, Rodina is the only one with zero forehands. But she isn’t really an outlier. 23 other women hit fewer than 10 forehands in all of their charted matches, including Timea Bacsinszky, who opted for the forehand only four times in 32 matches.

Faced with a makeable ball in the backhand corner, men and women both hit a non-slice groundstroke about four-fifths of the time. But of those topspin and flat strokes, women stick with the backhand 94% of the time, compared to 82% for men.

A few WTA players seek out opportunities to run around their backhands, including Sam Stosur and Polona Hercog, both of whom hit the forehand 20% of the time they are pushed into the backhand corner. Ashleigh Barty also displays more Federer-like tactics than most of her peers, using the forehand 13% of the time. Yet most of the women with powerful forehands, like Serena Williams, have equal or better backhands, making it counter-productive to run around the shot. Serena hits a forehand only 1% of the time her opponent sends a makeable ball into her backhand corner.

Directional decisions

Backhand or forehand, let’s start by looking at which specific shot that players chose. The Match Charting Project contains shot-by-shot logs of about 2,900 women’s matches from the 2010s, including 365,000 makeable balls hit to one player’s backhand corner. (“Makeable” is defined as a ball that either came back or resulted in an unforced error.)

Here is the frequency with which players hit backhand and forehands in different directions from their backhand corner. I’ve included the ATP numbers for comparison:

BH Direction               WTA Freq  ATP Freq  
Down the line                 17.4%     17.4%  
Down the middle               35.2%     29.5%  
Cross-court                   47.3%     52.9%  
                                               
FH Direction               WTA Freq  ATP Freq  
Down the line (inside-in)     35.2%     35.1%  
Down the middle               16.2%     12.8%  
Cross-court (inside-out)      48.4%     51.8%

Once a forehand or backhand is chosen, there isn’t much difference between men and women. Women go up the middle a bit more often, which may partly be a function of using the topspin or flat backhand in defensive positions slightly more than men do. I’ve also observed that today’s top women are more likely to hit an aggressive shot down the middle than men are. The level of aggression and risk may be similar to that of a bullet aimed at a corner, but when we classify by direction, it looks a bit more conservative. That’s just a theory, however, so we’ll have to test that another day.

Point probability

Things get more interesting when we look at how these choices affect the likelihood of winning the point. On average, a woman faced with a makeable ball in her backhand corner has a 47.2% chance of winning the point. (For men, it’s 47.7%.) The serve has some effect on the potency those shots toward the backhand corner. If the makeable ball was a service return–presumably weaker than the average groundstroke–the probability of winning the point is 48.2%. If the makeable ball is one shot later, an often-aggressive “serve-plus-one” shot, the chances of fighting back and winning the point are only 46.3%. It’s not a huge difference, but it is a reminder that the context of any given shot can affect these probabilities.

The various decisions available to players each have their own effect on the probability of winning the point, at least on average. If a woman chooses to hit a down-the-line backhand, her likelihood of winning the point increases to 53.0%. If she makes that shot, her odds rise to 68.4%.

The following table shows those probabilities for every decision. The first column of percentages, “Post-Shot,” indicates the likelihood of winning after making the decision–the 53.0% I just mentioned. The second column, “In-Play,” is the chance of winning if she makes that shot, like 68.4% for the down-the-line backhand.

Shot      Direction  Post-Shot  In-Play  
Backhand  (all)          48.5%    55.2%  
Backhand  DTL            53.0%    68.4%  
Backhand  Middle         44.6%    48.8%  
Backhand  XC             49.9%    55.8%  
                                         
Forehand  (all)          56.3%    56.1%  
Forehand  DTL (I-I)      61.4%    73.7%  
Forehand  Middle         45.7%    50.3%  
Forehand  XC (I-O)       56.2%    64.4%

The down-the-line shots are risky, so the gap between the two probabilities is a big one. There is little difference between Post-Shot and In-Play for down-the-middle shots, because they almost always go in. For the forehand probabilities, keep in mind that they are skewed by the selection of players who choose to use their forehands more often. Your mileage may vary, especially if you play like Rodina does.

Cautious recommendations

Looking at this table, you might wonder why a player would ever make certain shot selections. The likelihood of winning the point before choosing a wing or direction is 47.2%, so why go with a backhand down the middle (44.6%) when you could hit an inside-in forehand (61.4%)? It’s not the risk of missing, because that’s baked into the numbers.

One obvious reason is that it isn’t always possible to hit the most rewarding shot. Even the most aggressive men run around only about one-quarter of their backhands, suggesting that it would be impractical to hit a forehand on the remaining three-quarters of opportunities. That wipes out half of the choices I’ve listed. And even a backhand wizard such as Simona Halep can’t hit lasers down the line at will. The probabilities reflect what happened when players thought the shot was the best option available to them. Even though were occasionally wrong, this is very, very far from a randomized controlled trial in which a scientist told players to hit a down-the-line backhand no matter what the nature of the incoming shot.

Another complication is one that I’ve already mentioned: The success rates for rarer shots, like inside-in forehands, reflect how things turned out for players who chose to hit them. That is, for players who consider them to be weapons. It might be amusing to watch Monica Niculescu hit inside-out topspin forehands at every opportunity, but it almost certainly wouldn’t improve her chances of winning. You only get those rosy forehand numbers if you can hit a forehand like Stosur does.

That said, the table does drive home the point that conservative shot selection has an effect on the probability of winning points. Some women are happy sending backhand after backhand up the middle of the court, and sometimes that’s all you can do. But when more options are available, the riskier choices can be more rewarding.

Player probabilities

Let’s wrap up for today by taking a player-by-player look at these numbers. We established that the average player has a 47.2% chance of winning the point when a makeable shot is arcing toward her backhand corner. Even though Tsvetana Pironkova’s number is also 47.2%, no player is average. Here are the top 14 players–minimum ten charted matches, ranked by the probability of winning a point from that position. I’ve also included the frequency with which they hit non-slice backhands:

Player                     Post-Shot  BH Freq  
Kim Clijsters                  53.4%    77.6%  
Na Li                          53.2%    87.5%  
Camila Giorgi                  52.9%    93.8%  
Patricia Maria Tig             52.1%    66.1%  
Simona Halep                   52.1%    83.6%  
Belinda Bencic                 51.5%    91.7%  
Dominika Cibulkova             51.3%    70.1%  
Veronika Kudermetova           50.9%    73.9%  
Jessica Pegula                 50.7%    73.7%  
Su-Wei Hsieh                   50.6%    81.8%  
Dayana Yastremska              50.6%    87.6%  
Anna Karolina Schmiedlova      50.3%    87.4%  
Serena Williams                49.9%    89.2%  
Sara Errani                    49.8%    70.0%

These numbers are from the 2010s only, so they don’t encompass the entire careers of the top two players on the list, Kim Clijsters and Li Na. It is particularly impressive that they make the cut, because their charted matches are not a random sample–they heavily tilt toward high-profile clashes against top opponents. The remainder of the list is a mixed bag of elites and journeywomen, backhand bashers and crafty strategists.

Next are the players with the best chances of winning the point after hitting a forehand from the backhand corner. I’ve drawn the line at 100 charted forehands, a minimum that limits our pool to about 50 players:

Player                Post-Shot  FH Freq  
Maria Sharapova           69.0%     4.1%  
Dominika Cibulkova        65.1%    10.5%  
Ana Ivanovic              64.7%    11.1%  
Yafan Wang                64.4%     8.8%  
Rebecca Peterson          63.4%    15.2%  
Simona Halep              63.1%     6.8%  
Carla Suarez Navarro      63.0%     7.7%  
Andrea Petkovic           62.3%     5.3%  
Christina McHale          61.9%    15.2%  
Anastasija Sevastova      61.3%     4.2%  
Petra Kvitova             60.8%     4.6%  
Caroline Garcia           60.7%     7.5%  
Misaki Doi                60.5%    17.0%  
Madison Keys              59.3%     9.3%  
Elina Svitolina           59.1%     3.9%

Maria Sharapova is the Gilles Simon of the WTA. (Now there’s a sentence I never thought I’d write!) Both players usually opt for the backhand, but are extremely effective when they go for the forehand. Kudos to Sharapova for her well-judged attacks, though it could be that she’s leaving some points on the table by not running around her backhand more often.

Next

As I wrote on Thursday, we’re still just scratching the surface of what can be done with Match Charting Project data to analyze tactics such as this one. A particular area of interest is to break down backhand-corner opportunities (or chances anywhere on the court) even further. The average point probability of 47.2% surely does not hold if we look at makeable balls that started life as, say, inside-out forehands. If some players are facing more tough chances, we should view those numbers differently.

If you’ve gotten this far, you must be interested. The Match Charting Project has accumulated shot-by-shot logs of nearly 7,000 matches. It’s a huge number, but we could always use more. Many up and coming players have only a few matches charted, and many interesting matches of the past (like most of those played by Li and Clijsters!) remain unlogged. You can help, and if you like watching and analyzing tennis, you should.

Weighing Options From the Backhand Corner

A few weeks ago, I offered a “first look” at the down-the-line backhand. I offered a stack of Match Charting Project-based stats showing how often players opted to play that shot, what happened when they did, how lefties differ from righties, and which players stood out thanks to the frequency or success of their down-the-line strikes.

Like Richard Gasquet returning a serve, we need to take a step back before we can move forward. Rather than continuing to focus solely on the down-the-line backhand, let’s expand our view to all shots played from the backhand corner. The DTL backhand is only one choice among many. A player in position to go down the line has the option of a cross-court shot or a more conservative reply up the middle. She also might run around the backhand entirely, taking aim with a forehand up the line (“inside-in”), down the middle, or cross-court (“inside-out”).

Every shot is a choice, and one of the roles of analytics is to analyze the pros and cons of decisions players make. Ideally, we would even be able to identify cases in which pros make poor choices and recommend better ones. We’re still many steps away from that, at least in any kind of systematic way. But thanks to the thousands of matches with shot-by-shot data logged by the Match Charting Project, we have plenty of raw material to help us get closer.

The first choice

In 2,700 charted men’s matches from the last decade (happy new year!), I isolated about 450,000 situations in which one player had a makeable ball in his backhand corner, excluding service returns. The definition of “makeable” is inherently a bit messy. For today’s purposes, a makeable ball is one that the player managed to return or one that turned into an unforced error. With ball-tracking data, we could be more precise, but for now we need to accept this level of imprecision.

Of the 450,000 makeable backhand-corner balls, players hit (non-slice) backhands 63.7% of the time and (non-slice) forehands 14.3% of the time. The remaining 22% were divvied up among slices, dropshots, and lobs, and we’ll set those aside for another day.

Here’s how 2010s men chose to aim their backhands from the backhand corner:

  • Down the line: 17.4%
  • Down the middle: 29.5%
  • Cross-court: 52.9%

And their forehands from the same position:

  • Down the line (inside-in): 35.1%
  • Down the middle: 12.8%
  • Cross-court (inside-out): 51.8%

The inside-in percentage is a bit surprising at first, though we need to keep in mind that it’s 35% of a relatively small number, accounting for only 5% of total shots from the backhand corner. Less surprising is the much higher frequency of shots going cross-court. Not only is that a safer, higher-percentage play, it directs the ball to the opponent’s backhand (unless he’s a lefty), which is typically his weaker side.

Point probability

Shot selection is only a means to an end. More important than deploying textbook-perfect strategy is winning the point, and that’s where we’ll turn next.

The average ATPer has a 47.7% chance of winning the point when faced with a makeable ball in his backhand corner. Of course, any particular opportunity could be much better or worse than that. But again, without camera-based ball-tracking data, we can’t make more accurate estimates for specific chances. We can get some clues as to the range of probabilities by looking at how they vary at different stages of the rally. When a player has an opportunity for a “serve-plus-one” shot in the backhand corner–the third shot of the rally–his chances of winning the point are higher, at 51.1%. On the fourth shot of the rally, when pros are often still recovering from the disadvantage of returning, the chances of winning the point from that position are 45.4%. Context matters, in large part because context offers hints as to whether certain shots are better or worse than average.

So far, we have an idea of the probability of winning the point before making a choice. There are two ways of looking at the probability after choosing and hitting a shot: the odds of winning the point after hitting the shot, and the odds of winning the point after making the shot. The second number is obviously going to be better, because we simply filter out the errors. By excluding what could go wrong, it doesn’t give us the whole picture, but it does provide some useful information, showing which shots have the capacity to put opponents in the worst positions.

Here are the point probabilities for each of the shots we’re considering. For each choice, I’ve shown the probability of winning the point after hitting the shot (“Post-Shot”) and after making the shot (“In-Play”).

Shot      Direction  Post-Shot  In-Play  
Backhand  (all)          48.2%    54.2%  
Backhand  DTL            51.4%    64.6%  
Backhand  Middle         44.2%    48.2%  
Backhand  XC             49.5%    54.6%  
                                         
Forehand  (all)          55.1%    63.0%  
Forehand  DTL (I-I)      58.5%    69.0%  
Forehand  Middle         47.3%    52.0%  
Forehand  XC (I-O)       54.9%    61.9% 

Forehands tend to do more to improve point-winning probability than backhands, though the down-the-middle forehand is less effective than a backhand to either corner. Again, this is context talking: A player who runs around a backhand just to hit a conservative forehand may have misjudged the angle or spin of the ball and felt forced to make a more defensive play. Still, it’s a relatively common tactic on slower clay courts (on clay, it is almost twice as common than tour average), and it may be used too often.

The most dramatic differences between the two probabilities are on the down-the-line shots. Both forehand and backhand are aggressive, high-risk shots, something reflected in the winner and unforced error rates for each. 9% of all shots from the backhand corner are winners, and another 11% are unforced errors. Of down-the-line shots, 23% are winners and 19% are unforced errors. While the choice to go down the line isn’t superior to other options, both the forehand and backhand are devastating shots when they work.

Player by player

Let’s tentatively measure “effectiveness” in terms of increasing point probability. Setting aside the complexity of context, which won’t be the same for every player, the most effective pro is the one who makes the most of a certain class of opportunities.

Here are the 10 best active players (of those with at least 20 charted matches) who do the most when faced with a makeable ball in their own backhand corner. Keep in mind that the average player has a 47.7% chance of winning the point from that position:

Player                Post-Shot  
Rafael Nadal              52.9%  
Diego Schwartzman         52.4%  
Novak Djokovic            52.3%  
Nikoloz Basilashvili      51.9%  
Andrey Rublev             51.8%  
Kei Nishikori             51.5%  
Gilles Simon              51.2%  
Pablo Cuevas              50.9%  
Alex De Minaur            50.0%  
Pablo Carreno Busta       49.6%

The Match Charting Project data might understate just how effective Rafael Nadal, Novak Djokovic, and Kei Nishikori are from their backhand corner, since a disproportionate number of their charted matches are against other top players. In any case, it is no surprise to see them here, along with such backhand warriors as Diego Schwartzman and Gilles Simon.

This list is limited to the tour regulars with at least 20 matches charted. One more name to watch out for is Thomas Fabbiano, with only 12 matches logged so far. In that limited sample, his point probability from the backhand corner is a whopping 59.2%. He isn’t quite that much of an outlier in reality, since his charted matches include contests against Ivo Karlovic, Reilly Opelka, and Sam Querrey, opponents whose ground games leave a bit to be desired. But his overall figure is so far off the charts that, even adjusting downward by a hefty margin, he appears to be one of the more dangerous players on tour from that position.

Forehands and backhands

Let’s wrap up by looking at something a bit more specific. For backhands and forehands (without separating by direction), which players are most effective after hitting that shot from the backhand corner? We’re continuing to define effectiveness as winning as many points as possible after hitting the shot. I’ll also show how often each of the players opts for their effective shot, giving us a glimpse at tactical decisions, not just tactical success.

Here are the best backhands from the backhand corner. It was supposed to be a top ten list, but I think you’ll understand why I struggled to cut it off before listing the top 16 players, roughly one-fifth of the 75 players with at least 20 charted matches:

Player                 Post-shot  BH Freq  
Diego Schwartzman          52.8%    74.0%  
Rafael Nadal               52.7%    64.7%  
Novak Djokovic             52.7%    76.1%  
Kei Nishikori              51.7%    74.0%  
Gilles Simon               51.4%    88.0%  
Andrey Rublev              51.1%    67.1%  
Pablo Carreno Busta        51.1%    75.3%  
Nikoloz Basilashvili       51.0%    75.0%  
Alexander Zverev           50.8%    75.1%  
Alex de Minaur             50.6%    74.8%  
Daniil Medvedev            50.6%    87.2%  
Juan Martin del Potro      50.3%    49.1%  
Pablo Cuevas               50.2%    60.6%  
Andy Murray                50.1%    65.0%  
Richard Gasquet            49.9%    75.8%  
Stan Wawrinka              49.8%    63.4%

The “BH Freq” column–for backhand frequency–really demonstrates the range of tactics used by different players. Gilles Simon and Daniil Medvedev opt for the topspin backhand almost every time, rarely slicing or running around the shot. At the opposite extreme, Juan Martin del Potro hits a topspin backhand less the half the time from that position. Perhaps because of his selectiveness–dealing with awkward positions by slicing–he is effective when he makes that choice.

Now the best forehands from the backhand corner:

Player                 Post-shot  FH Freq  
Gilles Simon               63.1%     6.7%  
Rafael Nadal               61.9%    16.6%  
Benoit Paire               61.9%     1.5%  
Kei Nishikori              61.2%    10.4%  
Andrey Rublev              61.0%    20.1%  
Casper Ruud                60.8%    27.1%  
Marton Fucsovics           60.5%    16.3%  
Novak Djokovic             60.0%     9.7%  
Daniil Medvedev            59.8%     3.3%  
Pablo Cuevas               58.9%    20.9%  
Sam Querrey                58.2%    15.6%  
Felix Auger Aliassime      57.7%    16.0%

This list is more of a mixed bag, in part because there are so many fewer forehands from the backhand corner. Benoit Paire’s numbers are based on a mere 21 shots. I wouldn’t take his effectiveness seriously at all, but it’s always entertaining to see evidence of his uniqueness. At the opposite end of the spectrum is Casper Ruud, who runs around his backhand more than anyone else in the charting dataset except for Jack Sock and Joao Sousa. (Neither one of which is particularly effective, though presumably they do better by avoiding their backhands than they would by hitting it.)

One name you might have expected to see on the last list is Roger Federer. He’s around the 80th percentile in the forehand category, winning 56.9% of points when hitting a forehand from the backhand corner. He’s good, but not off the charts in this category. Like Nadal and Djokovic, he might look better if these numbers were adjusted for opponent, because so many of his charted matches are against fellow elites.

Next

There’s clearly a lot more to do here, including looking at probabilities for direction-specific shots, isolating the effect of certain opponents, and trying to control for more of the factors that aren’t explicitly present in the data. Not to mention extending the same framework to other shots from other positions on court. Stay tuned.

Tramlines and Wide Groundstrokes

The NextGen Finals are played on an unusual court, in that the surface is marked only for singles matches, leaving out the “tramlines” that define the doubles alleys. Virtually all tennis events includes doubles, as well, so this is rarely an option. The ATP has skipped tramlines at season-ending events before, but at the end of the 2010s, the singles-only court is exclusive to the NextGen Finals.

One might reasonably wonder whether the unique paint job has any effect on play:

I discussed this on a recent podcast with Erik Jonsson, and we tentatively concluded that tennis pros (even young ones) with thousands of hours of playing experience shouldn’t be affected by a tweak to the appearance of the court. But why speculate when we can look at some data?

The Match Charting Project, my volunteer-driven effort to log shot-by-shot records of professional tennis matches, notes various details about errors–forced or unforced, and “type”–net, deep, wide, or wide-and-deep. MCP contributors didn’t immediately take to the NextGen Finals–before this week, the 2018 final was the only charted match out of the 6,600 matches in the dataset–but 2019 was different. We now have shot-by-shot stats for 8 of the 15 matches played in Milan last week. (Big thanks to Carrie, who took charge of Alex de Minaur’s entire run to the final.)

Quantifying wide errors

We’re interested in the frequency of wide errors, which isn’t quite as simple as it sounds. I chose to focus only groundstrokes, and I also excluded forced errors–shots on which the player might not have much control of the direction of the ball.

Here are three metrics we could use for the frequency of wide errors:

  • Wide errors per point
  • Wide errors per unforced error
  • Wide errors per “makeable” groundstroke–that is, groundstrokes that were either unforced errors or put in play

Wide errors per point is probably too crude, but it does have the advantage of simplicity. Wide errors per unforced error might have some value, telling us in what direction a player was most aggressive. The last, wide errors per makeable groundstroke, is probably the best representation of what we’re looking for, as it tells us how frequently a player tried to hit a shot and it went wide.

Here are de Minaur’s numbers for his five 2019 NextGen matches, along with his hard-court aggregates from 28 other charted matches in the last two years:

          Wide / Pt  Wide / UFE  Wide / GS  
NextGen        2.7%        1.5%      21.7%  
ATP Hard       3.0%        1.4%      21.4%

At least for Alex, the tramlines don’t seem to make much of a difference.

Let’s look at the slightly larger group of players. We have eight matches, which means 16 records of one match for a single player, including at least one for each of the eight guys who qualified for Milan. Here are the three wide-error rates for the NextGen Finals matches, along with the same players’ wide-error rates for other charted hard court matches in the last two years:

          Wide / Pt  Wide / UFE  Wide / GS  
NextGen        3.2%        1.8%      19.5%  
ATP Hard       3.2%        1.8%      23.1%

For our first two metrics, there is absolutely no effect. Tramlines or no tramlines, wide errors mark the end of 3.2% of points, and 1.8% of total unforced errors. (The 3.2% figure is per player, meaning that 6.4% of points were ended with a wide error.)

The third metric, though, is more interesting. On tour, these players make a wide error on 23.1% of their “makeable” groundstrokes. That number dropped by more than one-seventh, to 19.5%, on the tramline-free court in Milan. At the same time, the overall rate of unforced errors (not just wide errors) increased compared to the same players’ efforts on hard courts at other events.

Deep mind

I see two possible explanations for such a substantial drop. First, we don’t have much data, and maybe it’s just a fluke of a small sample. Some of the difference can be traced to Ugo Humbert, who didn’t make a single wide error in his one charted NextGen Finals match. (Humbert’s usual wide-error rates are close to average.) Without a lot more matches played on tramline-free surfaces–not to mention charts of those matches–we won’t be able to draw a firm conclusion.

Second, it could be a real effect stemming from some aspect of the conditions in Milan. The lack of tramlines really might, as Lisa puts it, “focus the mind.”

Compared to other innovations trialed at the NextGen Finals, the singles-only court gets very little press. But unlike, say, the towel rack or the shot clock, it might just have a small effect on play.