Coco Gauff’s Big What-If

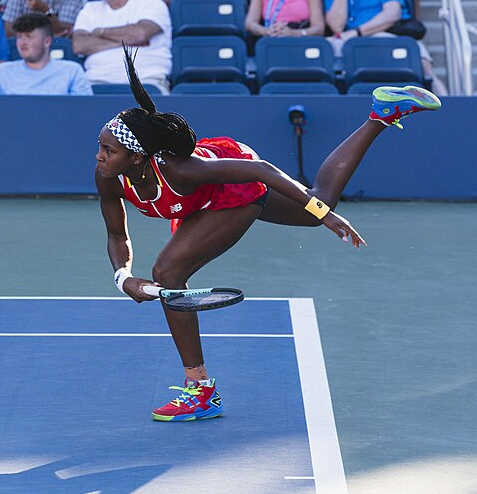
Coco Gauff at the 2022 US Open. Credit: All-Pro Reels

The best players are able to work around their weaknesses. Coco Gauff is so solid that she has overcome two: an unreliable forehand and a second serve that hands too many points to her opponents. On Wednesday in Wuhan, Gauff coughed up 5 double faults out of 19 second serves. Despite surrendering more than 10% of her serve points for the fifth consecutive match, she eased past Viktoriya Tomova. The Bulgarian managed just three games.

The forehand is a subject for another day. Lately, the serve has been a bigger concern, the one blot on an eight-match win streak (and counting) in China.

Start with season totals. Through last week’s Beijing final, Gauff has missed more than one in five of her second serves. The result: She has double-faulted 8.9% of her 2024 service points. No other woman in the WTA top 60 has double faulted so often.

The typical tour regular loses barely half so many points this way. Tour average is 5.1%. Fellow elites Iga Swiatek, Jessica Pegula, and Jasmine Paolini come in at 3% or lower; Emma Navarro just misses that mark at 3.1%. Even Aryna Sabalenka, with her recurring bouts of service shakiness and occasional risk-taking on the second serve, gives away only 4.5% of points.

Still, Coco rates as the fourth-best player in the world. She’ll be back to #3 on Monday, and she has a good chance of ending the season there. The rest of her game is so sturdy that she has piled up nearly 50 wins on the season despite committing 274 more double faults than Swiatek has.

This is uncharted territory. In the last 15 years–the extent of my serve stats for women’s tennis–only two players have hit double faults so often and still managed to finish in the top five. No one has cracked the top three:

DF Rate  Player             Year  Rank  
  10.4%  Aryna Sabalenka    2022     5  
   9.6%  Maria Sharapova    2011     4  
   8.9%  Coco Gauff         2024     ?  
   8.7%  Elena Dementieva   2009     5  
   8.4%  Maria Sharapova    2015     4  
   8.1%  Dinara Safina      2008     3  
   7.9%  Dinara Safina      2009     2  
   7.9%  Maria Sharapova    2014     2  
   7.9%  Karolina Pliskova  2021     4  
   7.6%  Victoria Azarenka  2013     2  
   7.6%  Aryna Sabalenka    2021     2  
   7.5%  Maria Sharapova    2013     4  
   7.3%  Maria Sharapova    2012     2  
   7.0%  Venus Williams     2010     5

The typical year-end number one double faults only 4.1% of the time. Victoria Azarenka’s 2012 season, at 6.8%, was the only such occasion over 6%. This isn’t exactly a law of physics, but if Gauff is to dislodge the two women atop her in the ranking table, she’ll probably need to make a substantial move in that direction.

What-ifs

It’s no easy task to fix a leaky serve. The good news for Coco is that it may be all she needs to do.

Back to the season totals. Gauff is basically tied with Swiatek as the best returner in the game. The American has won 48.4% of her return points this year, compared to Iga’s 48.5%. Gauff has played slightly weaker opposition, but in any case, it’s a minor gap. Both women stand well above the pack; no one else tops 47.5%. With no double faults working against her, Coco’s return game is worthy of a world number one.

By service points won–where the double faults come into play–Gauff ranks a more pedestrian 12th. That’s entirely because of the deliveries that miss. She wins more first-serve points than anyone except for Qinwen Zheng and Elena Rybakina. In an era without megastars, the combination of 1st or 2nd on return and 12th on serve might be good enough to lead the field, but with an all-rounder like Swiatek and a dominant slugger like Sabalenka to contend with, it doesn’t do the job.

Here, then, is the what-if. Wave a magic wand and proclaim that all of Gauff’s second serves find the box. The 9% of her service points that end in double faults turn into second serves in play: points that she wins at a 56% clip.

Do that, and her rate of serve points won–currently at 60.2%, good for 12th place–becomes 65.3%, better than anybody. A double-fault-free Coco Gauff would rack up more serve points than anyone on tour, while still winning almost as many return points as Iga does. A handful of key points might swing the year-end number one in either direction, but statistically, the American would be the best player in the world.

You might argue that even in the rosiest real-life scenario, Coco isn’t going to eliminate double faults entirely. Fair enough. Reduce her double fault rate to tour average, and she wins 62.5% of service points. Not as good as Swiatek, Sabalenka, or Rybakina (or, technically, Lulu Sun in her limited tour-level action), but ahead of everybody else.

Combine serve and return into total points won (TPW%), and we see how these wishful adjustments move Gauff clear of the field–or, at least, everyone except for Iga:

TPW%   Player                      
56.9%  Coco Gauff (no dfs)  
56.5%  Iga Swiatek                 
55.4%  Coco Gauff (avg dfs)  
54.3%  Coco Gauff (actual)  
54.3%  Aryna Sabalenka             
53.7%  Elena Rybakina              
53.1%  Karolina Muchova            
52.9%  Qinwen Zheng                
52.8%  Danielle Collins            
52.7%  Mirra Andreeva              
52.6%  Jessica Pegula              
52.3%  Victoria Azarenka           
52.3%  Maria Sakkari               
52.3%  Paula Badosa                
52.1%  Madison Keys                
52.0%  Jasmine Paolini

Actual-Coco is already near the top of the list. Take away all or half of her double faults, and at the very least she looks stronger than Sabalenka and Rybakina.

The specifics

This may seem a bit too abstract, especially since the total-points-won list has so many differences from the official ranking table. Greatness is not measured by points, but by titles, and some trophies count much more than others.

Remember that these points we’re changing took place in real–often close–matches. Reversing just a few of the double faults would have tipped the scales in Gauff’s direction. In the counterfactual, she probably didn’t lose 15 matches this year. She likely picked up more than two titles.

Take the most painful loss of the season: Coco’s fourth round defeat at the US Open. Against Emma Navarro, she committed a gut-wrenching 19 double faults. Despite that, she won 46.8% of total points. All else equal, had she landed those 19 second serves, Gauff would have almost exactly flipped the tally, winning 53.0% of points. Even with a tour-average double fault rate, she would have won 51.0% of points and–barring bad luck or a ill-timed choke–earned a victory.

Run the same exercise for the American’s other defeats this year, and we see just how strong her season could have been. If we reduce her double faults to a tour-average 5.1%, 4 of her 15 losses probably would have gone her way. Two more matches would have ended within a point of 50/50, safely in the range where a clutch (or lucky) break point or two can reverse the result.

Cut out double faults entirely, and Gauff wins at least 50.8% of points in six of the losses. She would have cleared 48% in four more, putting those in the range where luck could hand her the victory.

Even in the more conservative scenario, Gauff’s campaign looks quite different. Instead of losing to Anna Kalinskaya in the Dubai quarters, she would have faced off with Iga in the semi-finals. She wouldn’t have lost to Marta Kostyuk in Stuttgart: She’d have played Marketa Vondrousova for a place in the final. In Madrid, she would have handily beaten Madison Keys, earning a quarter-final date with Ons Jabeur. Flip the Navarro result in New York, and Coco could well have defended her US Open title.

Today’s action in Wuhan offered a glimpse of a sturdier future. Gauff cast aside Kostyuk with nary a double fault, advancing to the quarters in just 61 minutes. It was her quickest match since April–against an opponent who has bedeviled her in the past–and her first double-fault-free outing in 14 months.

The American has somehow established herself as a top-five player and grand slam champion despite handing her opponents more free points than any of her peers. A stingier Coco Gauff could soon be the best player in the world.

* * *

Subscribe to the blog to receive each new post by email:
 

Aryna Sabalenka Under Pressure

Also today: January 26, 1924

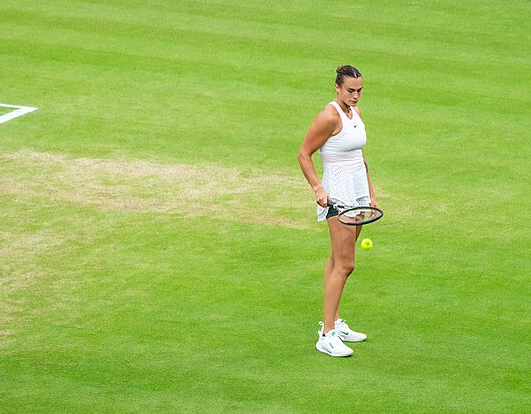
Aryna Sabalenka at Wimbledon in 2023. Credit: Adrian Scottow

It felt like a pivotal moment. Aryna Sabalenka had taken a 5-2 first-set lead in yesterday’s Australian Open semi-final against Coco Gauff. Gauff kept the set going with a strong service game for 5-3. Sabalenka lost the first point on her serve, but bounced back with a plus-one backhand winner.

At 30-15, the American struck again. She took advantage of a Sabalenka second serve to drag the Belarusian into a backhand rally, ultimately drawing an unforced error on the ninth shot and putting the game back in play.

Then, still just two points from the set, Sabalenka double-faulted.

The narrative practically writes itself. Aryna hits hard, aims for the lines, and keeps points short. Let her do that, and she will destroy you. Her first five opponents in Melbourne managed a grand total of 16 games against her. On the other hand, if you keep the ball in play, she’ll start pressing, trying too hard to dictate with her serve, going for too much when a smackable groundstroke presents itself.

Gauff, by this reading, is Sabalenka’s nightmare opponent. She won the US Open final by denying the Belarusian one would-be winner after another. Not only can she take Sabalenka’s game away from her, but Coco–at least on a good day–won’t give it back on her own serve. When she lets loose, Gauff wields just as much power as her more tactically aggressive opponent.

As it turned out, Sabalenka did lose that service game. Several twists and turns later, Gauff led the set, 6-5. Only then did Aryna regroup, winning four straight points from 30-love to force a tiebreak, then dropping just two more points to clinch the set. Gauff kept the second set close, but Sabalenka never allowed her to reach break point. The contest closed with a narrative-busting move: Facing match point, Gauff pulled out a 12-stroke rally, the kind of point that has been known to steer her opponent off course. But instead of compounding the damage, Sabalenka came back with two unreturned serves. Game over.

What to believe, then? Was the apparent first-set turning point a reflection of the true Sabalenka? Or is this the new Aryna, who slams the door when challengers sniff opportunity? Or is it something else, the all-too-common story in which someone looks like a clutch hero or a constant choker, only for us to discover, after crunching all the numbers, that she’s impervious to momentum and plays pretty much the same all the time?

Recovering at a disadvantage

Sabalenka’s serve games do follow a pattern after she loses a longish rally. But the results are not entirely straightforward.

On the next point (assuming the lost rally didn’t end the service game), Aryna is more likely to miss her first serve:

Year   1stIn%  post-rallyL-1stIn%  Change  
2019    61.2%               55.9%   -8.6%  
2020    61.5%               57.0%   -7.3%  
2021    58.6%               52.6%  -10.3%  
2022    60.0%               59.9%    0.0%  
2023    61.1%               61.3%    0.4%  
2024    63.3%               62.5%   -1.2%
----  
TOTAL   60.5%               57.6%   -4.8% 

Most of the effect is concentrated in the earlier years of her career on tour. Yesterday, the trend ran in the opposite direction: She made nearly 76% of her first serves overall, but after Gauff won a rally, she landed 88% of them.

The trend is clearer–and persisting to the present–when we look at double faults after losing a rally:

Year     DF%  post-rallyL-DF%  Change  
2019    8.6%            10.4%   20.8%  
2020    6.2%             8.4%   36.9%  
2021    7.9%            11.8%   50.3%  
2022   10.7%            10.1%   -5.5%  
2023    6.2%             7.2%   16.5%  
2024    3.4%             8.3%  144.7%  
----
TOTAL   7.9%             9.6%   22.5%

2022 was Aryna’s year of the yips; she was more likely to bunch double faults together than hit them in particularly nervy spots. (Put another way: Every spot was a nervy one.) The 2024 number will surely come back to earth, but it is still revealing: Sabalenka has made so much progress in this aspect of her game, but her second-serve struggles continue when she faces the threat of getting dragged into another rally.

Some of these effects persist even longer. From those service games that last long enough, here are Sabalenka’s first-in and double-fault percentages two points after losing a long rally:

Year   1stIn%  +2 1stIn%  Change    DF%  +2 DF%  Change  
2019    61.2%      55.8%   -8.8%   8.6%    8.7%    1.2%  
2020    61.5%      50.5%  -17.9%   6.2%    7.2%   17.1%  
2021    58.6%      56.0%   -4.5%   7.9%    8.7%   10.5%  
2022    60.0%      63.1%    5.3%  10.7%    7.8%  -27.1%  
2023    61.1%      59.2%   -3.2%   6.2%    8.4%   35.6%  
2024    63.3%      57.1%   -9.7%   3.4%    2.4%  -30.1%  
----
TOTAL   60.5%      57.1%   -5.6%   7.9%    8.0%    2.0% 

She continues to miss more first serves even two points after the rally setback. To some degree, the memory should have dissipated–after all, something else happened on the intervening point. On the other hand, she’s back in the same court. If a reliable serve didn’t work in the deuce court at 30-love, there’s reason to doubt it at 30-all.

The double fault trends are less clear, in part because our sample size is shrinking and double faults are blessedly rare. If nothing else, it’s safe to conclude that the explosion of double faults on the point after the lost rally doesn’t continue to nearly the same degree.

Tallying the cost

Now, this all seems bad. Sabalenka possesses one of the best first serves in the game; her whole attack is built around it. Her emergence as a superstar came after she got control of the service yips and cut her double faults down to manageable levels. After losing a long rally, she needs her serve more than ever, and–at least by comparison with other situations–it isn’t there for her.

Except… it doesn’t matter! At least not on the first point. Here is the bottom-line figure of service points won:

Year    SPW%  post-rallyL-SPW%  Change  
2019   59.6%             63.8%    7.2%  
2020   60.3%             56.6%   -6.0%  
2021   61.5%             61.3%   -0.3%  
2022   57.2%             59.9%    4.7%  
2023   63.7%             63.9%    0.4%  
2024   66.7%             70.8%    6.3%  
----
TOTAL  60.7%             61.7%    1.6% 

Fewer first serves, but more serve points won. It isn’t supposed to work like that, but Sabalenka bounces back strong from lost rallies. A shift of +1.6% in her favor is solid enough, and it’s even better if you look solely at the last three years.

Part of the explanation is that she tightens up the rest of her game–exactly the opposite of what my off-the-cuff narrative suggests. Under pressure, I hypothesized, she would try too hard to end points. Instead, after losing a long rally, she’s more willing than usual to play another one: She commits 14% fewer plus-one errors than her usual rate, implying a lower rate of aggression when she has an early chance to put the point away.

On the second point after losing a long rally, the bottom-line outcomes are more mixed:

Year    SPW%  +2 SPW%  Change  
2019   59.6%    53.9%   -9.5%  
2020   60.3%    55.3%   -8.3%  
2021   61.5%    58.5%   -4.9%  
2022   57.2%    61.5%    7.4%  
2023   63.7%    60.7%   -4.7%  
2024   66.7%    71.4%    7.1% 
---- 
TOTAL  60.7%    58.2%   -4.0%

While these aren’t as rosy as the next-point results, focus on the last few years. Since the beginning of 2022, Aryna has won more service points than usual when she returns to the serving direction where she recently lost a long rally–despite landing fewer first serves. She is even stingier with plus-one errors on these points, coughing up 29% fewer than usual.

These trends did not hold in yesterday’s semi-final. While Sabalenka made more first serves on the two points after Gauff outlasted her in a rally, fewer of them ended in her favor: 4% less on the first point, 12% less on the second. We can’t read too much into single-match totals with stats like these: 4% is a difference of one point. And Gauff is a far superior returner and baseline player than the typical WTAer, one who is unlikely to lose focus after going toe to toe with Sabalenka for a point or two. The average player pushes Aryna to a seventh shot barely one-tenth of the time; Gauff did so on one of every six points yesterday.

All of this leads us to an unexpected conclusion: Does Aryna Sabalenka have nerves of steel? First serves and double faults are just components in a larger picture; when we measure her results by points won, Sabalenka serves more successfully right after an opponent makes her uncomfortable. The yips are gone, and the on-court histrionics are a diversion that deceived us all. Aryna under pressure may be even more fearsome than her typical, terrifying self.

* * *

January 26, 1924: Suzanne’s longest day

Suzanne Lenglen wasn’t accustomed to spending much time on court. In eight tournaments since the 1923 Championships at Wimbledon, she had lost just ten games. Her doubles matches, especially with net maven Elizabeth Ryan at her side, were often just as lopsided. She never missed, she could put the ball anywhere on the court, and most opponents were lucky just to win a single point.

Lenglen and Ryan in 1925 at Wimbledon. Colorization credit: Women’s Tennis Colorizations

In January 1924, Lenglen eased her way back onto the circuit. Battling some combination of illness, anxiety, and hypochondria, she didn’t return to singles action until February. (She’d win her first three matches before dropping a game.) But she was a celebrity on the French Riviera, and she was prevailed upon to compete in doubles. She won the mixed at the Hotel Beau-Site tournament in Cannes to ring in the new year, and she entered both the women’s doubles–with Ryan–and the mixed at the Hotel Gallia tournament a few weeks later.

On the 26th, Lenglen and Ryan completed their waltz through the draw, defeating a British pair, Phyllis Covell and Dorothy Shepherd-Barron, 6-3, 6-4. Suzanne’s most aggravating foe was another Brit, a line judge with the temerity to call a foot-fault on the five-time Wimbledon champion. She tried to get the man removed and ultimately had to settle for his “voluntary” departure. “It is unfair,” she said. “The English are pigs.”

Her nerves would be tested even more severely in the mixed doubles final. Lenglen partnered Charles Aeschlimann of Switzerland, while Ryan teamed with the 43-year-old Canadian Henry Mayes. Both men were better known on the Riviera than in the tennis world at large, more clubbable than talented. Lenglen and Ryan–herself one of the top few woman players in the world–would be the stars of the show.

Lenglen and Aeschlimann took the first set, 6-4; Ryan and Mayes came back with a 6-1 frame of their own. The underdogs–that is, the team without Suzanne–built up an early lead in the third, thanks to Aeschlimann’s inconsistency and Ryan’s glittering play. Mayes served for a 4-2 advantage, but a lucky netcord halted their momentum, and the deciding set settled into a rhythm it wouldn’t break for 20 more games.

Only at 13-14 did Ryan finally give in. She gifted a double fault to her opponents, and Mayes’s fatigue–he had played a four-set men’s doubles final beforehand–began to tell. Lenglen and Aeschlimann broke serve, securing the 6-4, 1-6, 15-13 victory. It would stand as the longest set of Suzanne’s unparalleled career.

* * *

Subscribe to the blog to receive each new post by email:

 

The Cost of a Double Fault

We all know that double faults aren’t good, but it’s less clear just how bad they are. Over the course of an entire match, a single point here or there doesn’t seem to matter too much, especially when a double fault creeps in at a harmless moment, like 40-love. Yet many missed second serves are far more costly. Let’s try to quantify the impact of tennis’s most enervating outcome.

To do this, we need to think in terms of win probability. In each match, a player wins a certain percentage of service points and a certain percentage of return points. If those rates are sufficiently dominating–say, Mihaela Buzarnescu’s 65% of service points won and 59% of return points won in last week’s San Jose final–the player’s chance of winning the match is 100%. No matter how unlucky or unclutch she was, those percentages result in a win. But in a close contest, in which both players win about 50% of points (often referred to as “lottery matches”), the result is heavily influenced by clutch play and luck. In Buzarnescu’s tour de force, flipping the result of a single point would be meaningless. But in a tight match, like the Wimbledon semifinal between John Isner and Kevin Anderson, a single point could mean the difference between a spot in the championship match and an early flight home.

My aim, then, is to measure the average win probability impact of a double fault. To take another example, consider last week’s Washington quarter-final between Andrea Petkovic and Belinda Bencic. Bencic won nearly 51% of total points–59% of her service points and 42% on return–but lost in a third-set tiebreak. Those serve and return components were enough to give her a 56.3% chance of winning the match: claiming more than half of total points usually results in victory, but so close to 50%, there’s plenty of room for things to go the other way.

I refer to this match because double faults played a huge role. Bencic tallied 12 double faults in 105 service points, a rate of 11.4%, more than double the WTA tour average of 5.1%. Had she avoided those 12 double faults and won those points at the same rate as her other 93 service points, she would have ended up with a much more impressive service-points-won rate of 67%. Combined with her 42% rate of return points won, that implies an 87% chance of winning the match–more than 30 percentage points higher than her actual figure! Roughly speaking, each of her 12 double faults cost her a 2.5% chance (30% divided by 12) of winning the match.

A double fault rate above 10% is unusual, but a cost of 2.5% per offense is not. When we run this algorithm across the breadth of the ATP and WTA tours, we find that the cost of double faults adds up fast.

Tour averages

Using the method I’ve described above–replacing double faults with average non-double-fault service points–and taking the average of all tour-level matches in 2017 and 2018 through last week’s tournaments, we find that the average WTA double fault costs a player 1.83% of a win. Put another way, every 55 additional double faults subtracts one match from the win column and adds one to the loss column.

In the men’s game, the equivalent number is 1.99% of a win. The slightly bigger figure is due to the fact that men, on average, win more service points, so the difference between a double fault and a successful service offering is greater.

There is, however, an alternative way we could approach this. By comparing double faults to all other service points, we’re trading a lot of the double faults for first serve outcomes. We might be more interested in knowing how a player would fare if his or her second serve were bulletproof–still eliminating double faults, but replacing them specifically with second serves instead of a generic mix of service points.

In that case, the algorithm remains very similar. Instead of replacing double faults with non-double-fault serve points, we replace them with non-double-fault second serve points. Then the cost of a double fault is a little bit less, because second serve points result in fewer points won than service points overall. The second-serve numbers are 1.61% per double fault in the women’s game and 1.70% per double fault in the men’s game. For the remainder of this post, I’ll stick with the generic service points, but one approach is not necessarily better than the other; they simply measure different things.

Building a player-specific stat

Odious as double faults are, they are not completely avoidable. Very few players are able to sustain a double fault rate below 2%, and tour averages are around twice that. Since the beginning of 2017, the ATP average has been about 3.9%, and the WTA average roughly 5.1%, as we saw above.

We can measure players by considering their match-by-match double fault rates compared to tour average. In Bencic’s unfortunate case, her 12 double faults were 6.7 more than a typical player would’ve committed in the same number of service points. In contrast, in the same match, Petkovic recorded only 3 double faults in 102 service points, 2.2 double faults fewer than an average player would have.

We know that each WTA double fault affects a player’s chances of winning the match by 1.83%, so compared to an average service performance, Bencic’s excessive service errors cost her about a 17% chance of winning (6.7 times 1.83%), while Petkovic’s stinginess increased her own odds by about 6.6% (2.2 times 1.83%).

Repeat the process for every one of a player’s matches, and you can assemble a longer-term statistic. Let’s start with the WTA players who, since the start of last season, have cost themselves the most matches (“DF Cost”–negative numbers are bad), along with those who have most improved their lot by avoiding double faults:

Player                   DF%  DF Cost  
Kristina Mladenovic     7.7%    -3.84  
Daria Gavrilova         7.9%    -3.77  
Jelena Ostapenko        7.7%    -3.58  
Petra Kvitova           8.1%    -3.01  
Camila Giorgi           8.3%    -2.63  
Oceane Dodin           10.2%    -2.51  
Donna Vekic             7.0%    -1.91  
Venus Williams          6.7%    -1.71  
Coco Vandeweghe         6.4%    -1.60  
Aliaksandra Sasnovich   6.7%    -1.55  
…                                      
Agnieszka Radwanska     2.3%     1.27  
Sloane Stephens         2.1%     1.43  
Caroline Wozniacki      3.2%     1.43  
Barbora Strycova        3.5%     1.47  
Elina Svitolina         3.9%     1.48  
Simona Halep            3.5%     1.53  
Qiang Wang              2.6%     1.54  
Anastasija Sevastova    3.1%     1.57  
Carla Suarez Navarro    2.1%     1.67  
Caroline Garcia         3.6%     1.82

And the same for the men:

Player                  DF%  DF Cost  
Benoit Paire           6.2%    -4.51  
Ivo Karlovic           5.8%    -3.63  
Fabio Fognini          5.0%    -2.38  
Denis Shapovalov       6.3%    -2.26  
Grigor Dimitrov        5.1%    -2.25  
Gael Monfils           5.0%    -2.22  
David Ferrer           5.2%    -2.06  
Jeremy Chardy          5.3%    -2.00  
Fernando Verdasco      4.8%    -1.94  
Jack Sock              4.8%    -1.73  
…                                     
Roger Federer          2.1%     0.88  
Tomas Berdych          2.9%     0.89  
Juan Martin del Potro  2.8%     0.93  
Albert Ramos           3.1%     0.97  
Pablo Carreno Busta    2.2%     1.07  
Richard Gasquet        2.6%     1.12  
John Isner             2.6%     1.23  
Dusan Lajovic          1.9%     1.23  
Denis Istomin          1.9%     1.23  
Philipp Kohlschreiber  2.5%     1.24

Situational double faults

These aggregate numbers have the potential to hide a lot of information. They consider only two things about each match: how many double faults a player committed, and how close the match was. This statistic would treat Bencic the same whether she hit nine of her double faults at 40-love, or nine of her double faults in the third-set tiebreak. Yet the latter would have a colossally greater impact.

While this is an important limitation to keep in mind, it appears that double faults are distributed relatively randomly. That is, most players do not hit a majority of their double faults in particularly high- or low-leverage situations. The player lists displayed above show both the most basic stat–double fault percentage–along with my more complex approach. For players with at least 20 matches since the beginning of last season, double fault rate is very highly correlated with the match-denominated cost of double faults. (For men, r^2 = 0.752, and for women, r^2 = 0.789.) In other words, most of the variance in double fault cost can be explained by the number of double faults, leaving little room for other factors, such as the importance of the situation when double faults are committed.

That said, there’s plenty of room for additional analysis into those specific sitations. Instead of taking a match-level look at win probability, as I have here, one could identify the point score of every single one of a player’s double faults, and see how each event affected the win probability of that match. I suspect that, for most players, that would amount to a whole lot of extra complexity for not a lot of added insight, but perhaps there are some players who are uniquely able to land their second serve when it matters most, or particularly prone to double faults at key moments. This match-level look has made it clear how costly double faults can be, and it’s possible that for some players, missed serves are even more damaging than that.

How Servers Respond To Double Faults

Italian translation at settesei.it

In the professional game, double faults are quite rare. They sometimes reflect a momentary lapse in concentration, and can negatively impact a server’s confidence. Players are sometimes particularly careful after losing a point to a double fault, taking some speed off their next delivery, or aiming closer to the middle of the box.

Let’s dig into some data from last year’s grand slams to see what players do–and how it affects their results–immediately after double faults. IBM’s Slamtracker provided point-by-point data for most 2017 grand slam singles matches, including serve speed and direction, and the available matches give us about 5,000 double faults to work with. (I’ve organized the data and made it freely available here.)

For each server in each match, I’ve tallied their results on points immediately following double faults. (That means that we exclude after-double-fault points when the double fault ended the game.) Then, for each player, I compared those results with match-long averages. Because double faults are so unusual, and because we only have this data for the majors, the sample isn’t adequate to tell us much about individual players. But for tour-wide analyses, it’s more than enough.

Serve points won: As we’ll see in a moment, men and women have different overall tendencies on the point following a double fault. But by the most important measure of simply winning the next point, gender plays little part. Men, who in this sample win 65.1% of service points, fall just over one percentage point to 64.0% on the point following a double fault. Women, who average 57.8% of service points won, drop even more, to 56.1% after a double.

First serve percentage: I expected that servers become more conservative immediately after a double fault. For women, that hypothesis is correct: In these matches, they land 63.3% of their first serves, while after a double fault, that number jumps to 65.4%. On the other hand, men don’t seem to change their approach very much. On average, they make 62.3% of their first offerings, a number that barely changes, to 62.5%, after double faults.

First serve points won: Here is additional evidence that women become more conservative after double faults, while men do not. In general, women win 63.7% of their first serve points, but just after a double fault, that number drops to 62.9%. For men, there is a decrease in first serve points won, but it is almost as small as their difference in first serve percentage: 72.7% overall, 72.4% after a double fault.

First serve speed: With serve speed, we run into a limitation of the Slamtracker data, which gives us speed only for those serves that go in. So when we look at the average speed of first serves, we’re excluding attempts that miss the box. Even with that caveat, the data keeps pointing in the same direction. Contrary to my “conservative” hypothesis, men serve a bit faster than usual after a double fault–183.3 km/h following doubles, versus 182.8 km/h in general. Women do seem to change their tactics, dropping from an average speed of 155.5 km/h to a post-double-fault pace of 152.2 km/h.

First serve direction: Slamtracker divides serve direction into five categories: wide, body-wide, body, body-center, and center. After a double fault, men are less likely than usual to hit a wide serve (24.1% to 25.8%), and those serves get split roughly evenly between the body and center categories. The difference in body serves is most striking: They account for only 3.5% of first serves overall, but 4.4% of post-double first serves. This may be the one way in which men opt for the conservative path, by maintaining speed but giving themselves a wider margin of error.

Women move many of their after-double-fault serves toward the middle of the box. On average, over 44% of serves are classified as either “wide” or “center,” but immediately after a double fault, that number drops below 41%. It’s not a huge difference, but like all of the other tendencies we’ve seen in the women’s game, it suggests that for many players, caution creeps in immediately after missing a second serve.

Tactics

As usual, it’s difficult to move from these sorts of findings to any sort of tactical advice. Even the first data point, that both men and women win fewer service points than usual right after they’ve double faulted, can be interpreted in multiple ways. By one reading, players may be serving too conservatively, missing out of the benefits of big first serves. On the other hand, if confidence is an issue, perhaps serving more aggressively would just result in more misses.

When in doubt, we have to trust that the players and coaches know what they’re doing–they’ve honed these tradeoffs through decades of experience and thousands of hours of match play. For fans, these numbers add to our understanding of the conclusions that players have reached. For the pros, perhaps a more detailed look at what happens after a double fault would help tweak their own strategies, both bouncing back from their own double faults and taking advantage of the lapses in concentration of their opponents.